In addition to unemployment and employment trends, employment agencies in the survey also estimate the extent to which limited available labor makes it difficult to fill job openings in their agency district. The following response options are converted to a metric system:
No, not significantly
Yes, to a limited extent
Yes, to a greater extent
Yes, to a significant extent
The mean of all responses forms the labor shortage index. It is defined on a scale of 0 to 10, with higher values signaling greater labor shortages in the job filling process.
Data Table
Values rounded to one decimal.
Year
Month
Index-Value
2018
June
4.8
July
4.9
August
4.8
September
4.5
October
4.6
November
4.8
December
4.7
2019
January
4.6
February
4.7
March
4.6
April
4.6
May
4.7
June
4.8
July
4.4
August
4.3
September
4.3
October
4.4
November
4.4
December
4.3
2020
January
4.3
February
4.3
March
3.9
April
2.9
May
2.9
June
3.0
July
2.8
August
2.9
September
2.7
October
3.0
November
2.9
December
2.9
2021
January
3.0
February
3.1
March
3.1
April
3.1
May
3.0
June
3.3
July
3.6
August
3.7
September
3.9
October
4.0
November
4.0
December
4.3
2022
January
4.5
February
4.5
March
4.5
April
4.4
May
4.9
June
4.9
July
4.8
August
5.0
September
4.8
October
4.8
November
4.8
December
5.1
2023
January
5.3
February
5.2
March
5.2
April
5.3
May
5.3
June
5.3
July
5.3
August
5.1
September
4.8
October
5.0
November
4.8
December
4.7
2024
January
4.8
February
4.7
March
4.8
April
4.9
May
4.6
June
4.9
July
4.7
August
4.6
September
4.2
October
4.2
November
4.1
December
4.3
2025
January
4.2
February
4.1
March
4.1
April
4.0
May
4.0
June
4.0
July
3.7
August
3.6
September
3.7
October
3.7
November
3.8
December
3.6
2026
January
3.8
February
3.6
March
3.7
European Labour Market Barometer, March 2026
Year
Month
Component A
Component B
Labour Market Barometer
2018
June
102.3
105.6
104.0
July
102.4
105.4
103.9
August
102.1
105.0
103.6
September
101.6
104.5
103.1
October
102.3
104.7
103.5
November
102.0
104.6
103.3
December
101.5
104.2
102.9
2019
January
100.9
104.0
102.5
February
100.9
104.0
102.5
March
100.6
103.9
102.3
April
101.0
104.6
102.8
May
100.8
103.9
102.4
June
100.1
103.7
101.9
July
99.9
103.2
101.6
August
99.3
102.4
100.9
September
99.9
102.6
101.3
October
100.0
102.7
101.4
November
100.1
102.7
101.4
December
99.8
102.4
101.1
2020
January
99.8
102.4
101.1
February
99.6
102.6
101.1
March
99.0
101.7
100.4
April
92.9
94.4
93.7
May
93.1
94.9
94.0
June
94.3
95.7
95.0
July
96.2
96.2
96.2
August
97.6
97.0
97.3
September
98.9
97.9
98.4
October
99.6
98.6
99.1
November
99.0
98.6
98.8
December
99.2
99.3
99.3
2021
January
98.6
99.0
98.8
February
99.0
99.8
99.4
March
100.3
100.7
100.5
April
101.0
101.0
101.0
May
103.1
102.5
102.8
June
104.8
104.6
104.7
July
104.7
103.7
104.2
August
104.4
104.1
104.3
September
103.5
104.5
104.0
October
102.7
104.5
103.6
November
102.3
104.3
103.3
December
100.7
103.2
102.0
2022
January
101.6
103.3
102.5
February
102.4
103.8
103.1
March
102.1
103.6
102.9
April
103.1
104.1
103.6
May
102.2
103.7
103.0
June
100.4
103.4
101.9
July
99.8
102.8
101.3
August
99.4
102.2
100.8
September
98.8
101.9
100.4
October
98.7
101.5
100.1
November
98.9
101.7
100.3
December
98.7
101.3
100.0
2023
January
99.2
101.8
100.5
February
98.9
101.7
100.3
March
99.4
102.1
100.8
April
99.3
102.4
100.9
May
99.2
102.5
100.9
June
98.9
101.8
100.4
July
98.8
101.7
100.3
August
98.1
101.3
99.7
September
98.1
101.1
99.6
October
98.3
101.0
99.7
November
98.3
100.9
99.6
December
98.3
100.9
99.6
2024
January
98.0
100.7
99.4
February
98.1
100.8
99.5
March
98.5
100.8
99.7
April
98.9
100.9
99.9
May
98.1
100.3
99.2
June
98.5
100.7
99.6
July
98.8
101.2
100.0
August
98.6
100.1
99.4
September
98.7
100.5
99.6
October
98.6
100.6
99.6
November
98.6
100.6
99.6
December
98.3
100.6
99.5
2025
January
98.3
100.2
99.3
February
99.0
100.3
99.7
March
99.1
100.5
99.8
April
99.1
100.3
99.7
May
99.1
100.4
99.8
June
99.1
100.3
99.7
July
99.2
99.9
99.6
August
99.1
100.0
99.6
September
99.7
100.2
100.0
October
99.4
100.1
99.8
November
99.8
100.5
100.2
December
99.8
100.1
100.0
2026
January
99.4
100.2
99.8
February
99.1
100.1
99.6
March
99.3
100.2
99.8
Values above 100 signal a positive outlook, values below 100 signal a negative outlook.
Source: European Network of Public Employment Services, Institute for Employment Research (IAB). ©IAB
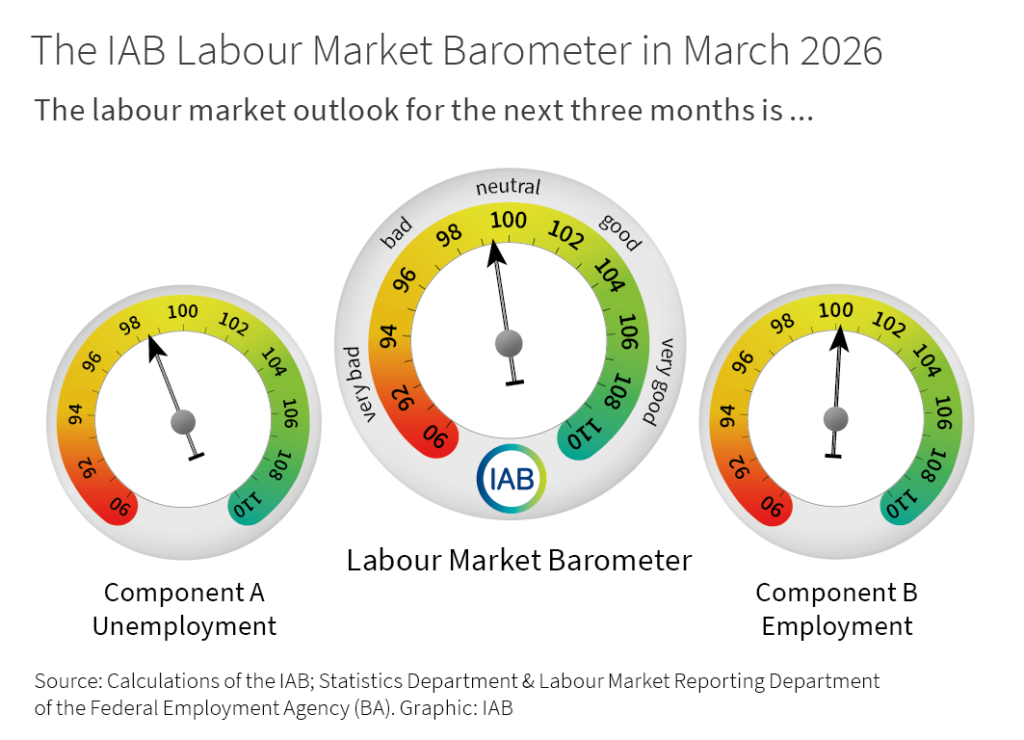
IAB Labour Market Barometer in March 2026
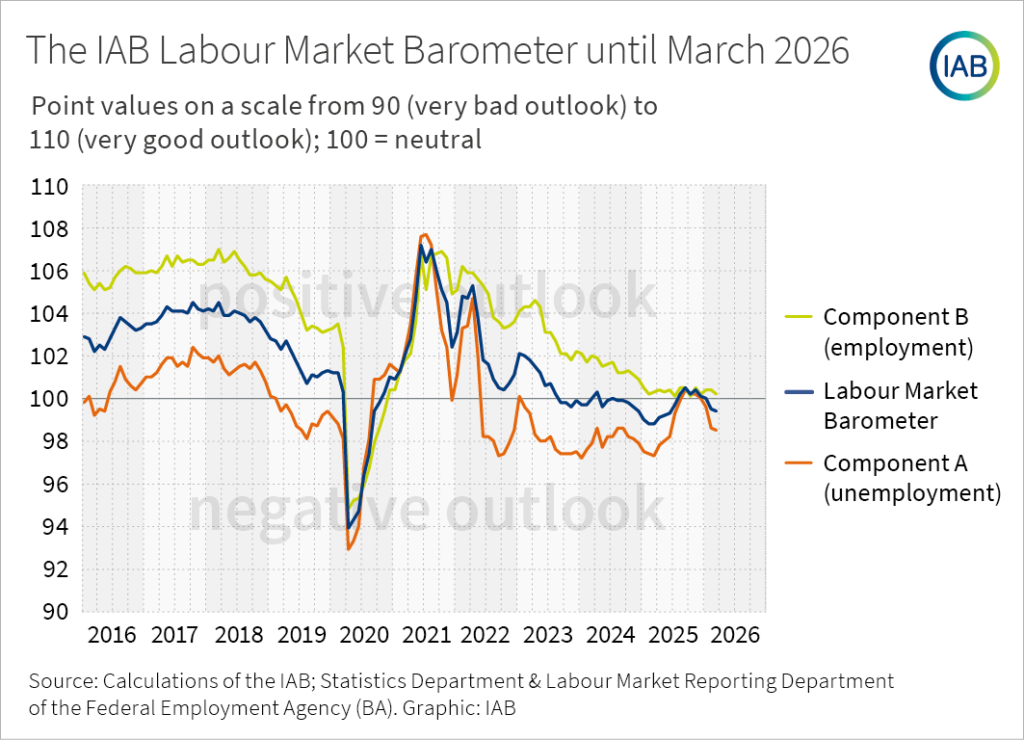
Time Series IAB Labour Market Barometer 2015 until March 2026
Accessible table of the time series of the IAB Labor Market Barometer
IAB Labour Market Barometer March 2026: 99.4
Component A (unemployment): 98.5
Component B (employment): 100.2
General information
The IAB labour market barometer provides good guidance for the labour market development in the near future, more precisely in the next three months. It is based on the expertise in all German employment agencies. Every month, their top-level staff is asked to assess the development of local unemployment and employment over the next three months. The IAB labour market barometer includes - in addition to component A that signals the unemployment development - a component B that signals the employment development. The IAB labour market barometer is the mean value of both partial indicators. It provides a more comprehensive picture of the expected development of the German labour market in the short term. The IAB labour market barometer is regularly released towards the end of month. Its scale goes from 90 (i.e. very negative outlook) to 110 (i.e. very positive outlook).
Release Dates
28.04.2026
27.05.2026
26.06.2026
29.07.2026
26.08.2026
28.09.2026
28.10.2026
25.11.2026
30.12.2026
Contact
Values above 100 signal a positive outlook, values below 100 signal a negative outlook.
Year
Month
Component A Unemployment
Component B Employment
Labour Market Barometer
2008
November
95.4
No data available No data available
December
95.1
No data available No data available
2009
January
95.0
No data available No data available
February
94.8
No data available No data available
March
93.8
No data available No data available
April
93.0
No data available No data available
May
93.8
No data available No data available
June
95.3
No data available No data available
July
97.7
No data available No data available
August
100.3
No data available No data available
September
101.3
No data available No data available
October
102.1
No data available No data available
November
102.8
No data available No data available
December
103.5
No data available No data available
2010
January
103.3
No data available No data available
February
101.9
No data available No data available
March
101.8
No data available No data available
April
104.2
No data available No data available
May
105.9
No data available No data available
June
106.3
No data available No data available
July
104.9
No data available No data available
August
104.8
No data available No data available
September
103.6
No data available No data available
October
103.4
No data available No data available
November
102.8
No data available No data available
December
102.0
No data available No data available
2011
January
102.0
No data available No data available
February
102.2
106.9
104.6
March
102.7
107.2
105.0
April
102.9
107.1
105.0
May
102.8
107.3
105.1
June
102.5
107.3
104.9
July
101.8
107.1
104.5
August
101.0
106.1
103.6
September
100.9
105.9
103.4
October
100.7
105.4
103.1
November
101.0
105.3
103.2
December
100.9
105.0
103.0
2012
January
100.9
104.9
102.9
February
99.9
104.7
102.3
March
99.7
104.6
102.2
April
99.4
104.5
102.0
May
99.1
104.2
101.7
June
98.5
103.7
101.1
July
97.3
103.5
100.4
August
97.5
103.4
100.5
September
97.7
103.2
100.5
October
97.9
103.2
100.6
November
98.1
102.4
100.3
December
98.4
102.6
100.5
2013
January
98.5
102.7
100.6
February
99.7
103.1
101.4
March
99.9
103.4
101.7
April
99.0
103.0
101.0
May
98.3
102.6
100.5
June
99.1
103.0
101.1
July
100.4
103.0
101.7
August
101.1
103.0
102.1
September
100.8
103.5
102.2
October
100.5
104.0
102.3
November
100.1
104.2
102.2
December
100.0
104.4
102.2
2014
January
100.4
104.3
102.4
February
101.3
104.6
103.0
March
100.8
104.3
102.6
April
100.7
104.8
102.8
May
100.4
105.2
102.8
June
100.2
105.0
102.6
July
100.2
104.8
102.5
August
100.3
104.6
102.5
September
100.4
104.5
102.5
October
100.6
103.7
102.2
November
100.6
104.2
102.4
December
100.9
104.2
102.6
2015
January
100.8
104.0
102.4
February
100.6
104.2
102.4
March
100.5
104.7
102.6
April
100.4
104.8
102.6
May
100.5
105.3
102.9
June
100.7
105.6
103.2
July
101.0
105.4
103.2
August
101.1
105.9
103.5
September
100.7
105.8
103.3
October
100.4
105.7
103.1
November
100.3
105.6
103.0
December
100.2
106.2
103.2
2016
January
99.8
105.9
102.9
February
100.1
105.4
102.8
March
99.2
105.1
102.2
April
99.5
105.4
102.5
May
99.4
105.1
102.3
June
100.3
105.2
102.8
July
100.8
105.7
103.3
August
101.5
106.0
103.8
September
100.9
106.2
103.6
October
100.6
106.1
103.4
November
100.4
105.9
103.2
December
100.7
105.9
103.3
2017
January
101.0
105.9
103.5
February
101.0
106.0
103.5
March
101.2
105.9
103.6
April
101.6
106.2
103.9
May
101.9
106.7
104.3
June
101.9
106.2
104.1
July
101.5
106.7
104.1
August
101.7
106.4
104.1
September
101.5
106.5
104.0
October
102.4
106.5
104.5
November
102.1
106.3
104.2
December
101.9
106.3
104.1
2018
January
101.9
106.5
104.2
February
101.7
106.5
104.1
March
102.0
107.0
104.5
April
101.4
106.4
103.9
May
101.1
106.6
103.9
June
101.3
106.9
104.1
July
101.5
106.5
104.0
August
101.6
106.2
103.9
September
101.4
105.8
103.6
October
101.7
105.8
103.8
November
101.3
105.9
103.6
December
100.8
105.6
103.2
2019
January
100.1
105.5
102.8
February
100.0
105.3
102.7
March
99.4
105.1
102.3
April
99.7
105.7
102.7
May
99.3
105.1
102.2
June
98.7
104.6
101.7
July
98.5
103.9
101.2
August
98.1
103.2
100.7
September
98.8
103.4
101.1
October
98.7
103.3
101.0
November
99.2
103.1
101.2
December
99.4
103.2
101.3
2020
January
99.1
103.3
101.2
February
98.8
103.5
101.2
March
98.1
102.4
100.3
April
92.9
94.8
93.9
May
93.3
95.2
94.3
June
94.0
95.3
94.7
July
96.8
95.9
96.4
August
98.1
96.7
97.4
September
100.9
97.9
99.4
October
100.9
98.6
99.8
November
101.1
99.4
100.3
December
101.6
100.4
101.0
2021
January
101.4
100.4
100.9
February
101.2
101.3
101.3
March
102.3
101.8
102.1
April
103.5
102.1
102.8
May
105.7
103.6
104.7
June
107.6
106.8
107.2
July
107.7
105.1
106.4
August
107.2
106.7
107.0
September
105.1
106.8
106.0
October
103.2
106.9
105.1
November
102.4
106.6
104.5
December
99.9
104.9
102.4
2022
January
101.1
105.1
103.1
February
103.3
106.2
104.8
March
103.4
105.9
104.7
April
104.7
105.9
105.3
May
102.0
105.6
103.8
June
98.2
105.3
101.8
July
98.2
104.9
101.6
August
98.0
103.8
100.9
September
97.3
103.6
100.5
October
97.4
103.3
100.4
November
97.9
103.4
100.7
December
98.5
103.6
101.1
2023
January
100.1
104.1
102.1
February
99.6
104.3
102.0
March
99.3
104.3
101.8
April
98.3
104.6
101.5
May
98.0
104.3
101.2
June
98.0
103.1
100.6
July
98.2
103.1
100.7
August
97.6
102.7
100.2
September
97.4
102.1
99.8
October
97.4
102.1
99.8
November
97.4
101.8
99.6
December
97.5
102.2
99.9
2024
January
97.2
102.1
99.7
February
97.6
101.7
99.7
March
97.9
102.0
100.0
April
98.6
101.9
100.3
May
97.7
101.5
99.6
June
98.2
101.6
99.9
July
98.2
101.7
100.0
August
98.6
101.2
99.9
September
98.6
101.2
99.9
October
98.2
101.3
99.8
November
98.1
101.1
99.6
December
97.9
100.9
99.4
2025
January
97.5
100.5
99.0
February
97.4
100.2
98.8
March
97.3
100.3
98.8
April
97.8
100.4
99.1
May
98.0
100.3
99.2
June
98.2
100.4
99.3
July
99.3
100.1
99.7
August
99.9
100.5
100.2
September
100.4
100.5
100.5
October
100.2
100.1
100.2
November
100.2
100.5
100.4
December
100.0
100.2
100.1
2026
January
99.6
100.4
100.0
February
98.6
100.4
99.5
March
98.5
100.2
99.4
Source: IAB calculations, BA statistics, BA labor market reporting. ©IAB
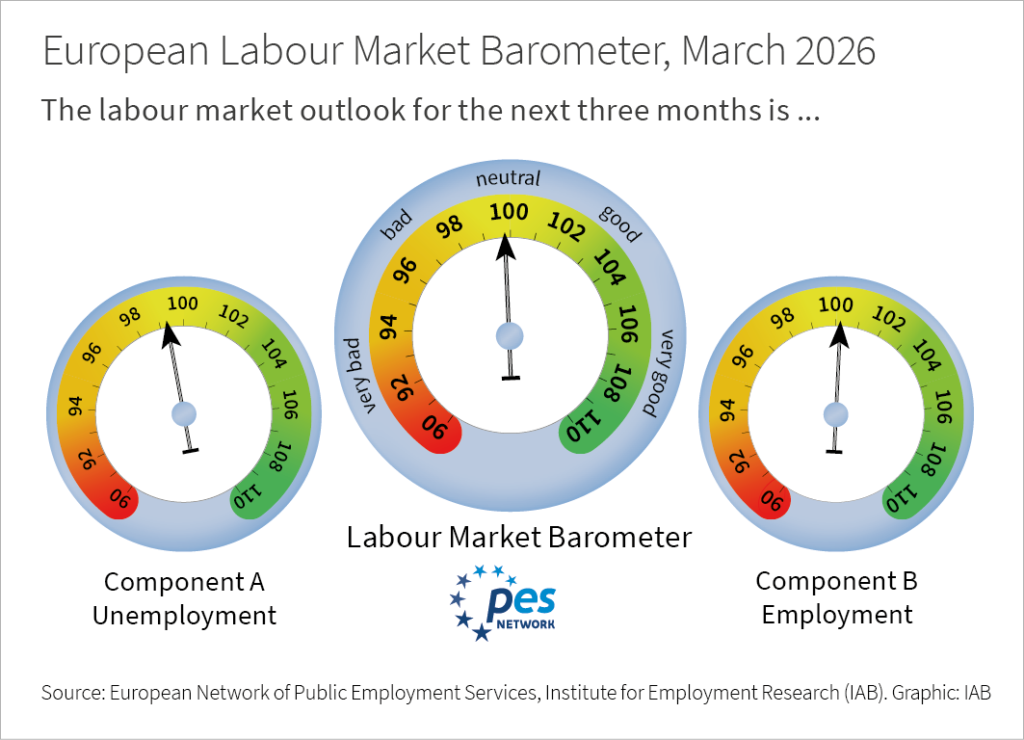
European Labour Market Barometer March 2026
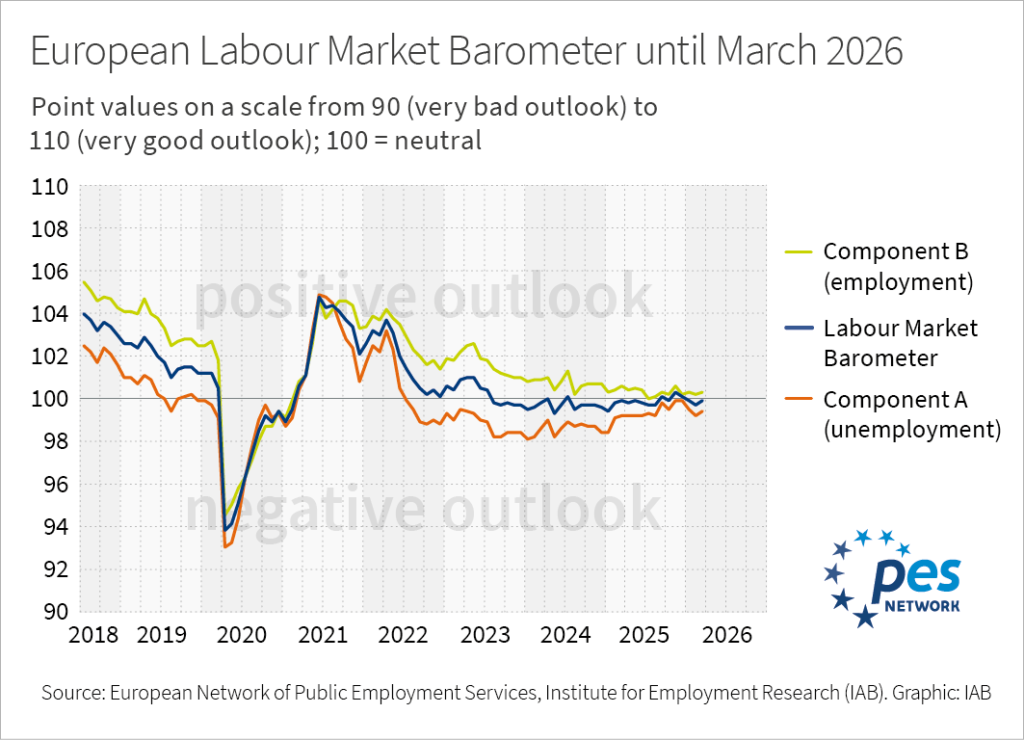
European Labour Market Barometer Time Series until March 2026
Accessible table of the time series of the European Labour Market Barometer
European Labour Market Barometer holds steady despite war in Iran
The European Labour Market Barometer rose by 0.2 points in March compared with the previous month, but at 99.8 points it remains below the neutral mark of 100 points. Both components of the leading indicator by the European Network of Public Employment Services and the IAB rose slightly. The employment component rose marginally by 0.1 points to 100.2 points, whilst the component forecasting unemployment rose by 0.2 points to 99.3 points. Employment thus remains stable, but unemployment could still rise slightly. “The European labour market outlook remains stagnant. Given the global situation, this can actually be seen as good news,” reports Enzo Weber, IAB head of forecast.
The time series of the European Labour Market Barometer, including its components for all 18 participating employment services, is available at www.iab.de/Presse/elmb-components . More information on the European Labour Market Barometer is available in our Magazine IAB-Forum: Launch of the “European Labour Market Barometer" .
Run by the European Network of Public Employment Services and the Institute for Employment Research (IAB), the European Labour Market Barometer is based on a survey of the local or regional employment agencies in 18 PES services. A leading indicator of employment and unemployment in labour markets, the survey has been carried out jointly by the employment services and the IAB since June 2018. Agencies are asked to assess both the unemployment and employment outlook for the next three months, resulting in two components and one barometer for each PES. The European barometer is then derived from these national scores in the form of a weighted average.
Participating countries include: Belgium (German-speaking community, Wallonia), Bulgaria, Denmark, Germany, Iceland, Latvia, Liechtenstein, Lithuania, Luxembourg, Malta, Austria, Poland, Portugal, Sweden, Switzerland, Spain and Cyprus. Latvia has been participating since June 2025.
Taken from: Labour market barometer helps predict (un)employment trends | European Social Fund Plus (europa.eu)
Release Dates
28 April 2026
27 May 2026
26 June 2026
29 July 2026
26 August 2026
28 September 2026
28 October 2026
25 November 2026
30 December 2026
Contact
The monthly Immigration Monitor (Zuwanderungsmonitor) analyses immigration, employment and unemployment of these nationality groups:
EU-27: member states of the European Union since 01 February 2020
EU-2: accession states of 01 January 2007: Bulgaria and Romania
EU-8: accession states of 01 May 2004: Estonia, Latvia, Lithuania, Poland, Slovenia, Slovakia, Czech Republic and Hungary
Countries of asylum origin: Afghanistan, Eritrea, Iraq, Iran, Nigeria, Pakistan, Somalia and Syria (IAB)
and Ukraine
The IAB Working Time Measurement Concept (IAB-Arbeitszeitrechnung, AZR) is the key product for the number of hours worked in Germany and underlies the German national accounts figure on labour input. The AZR is of great significance for the comprehensive analysis of labour market trends as well as cyclical fluctuations. It links changes in the number of hours worked as a result of collective agreements and economic fluctuations with changes in the employment structure and types of employment and thereby produces a differentiated picture of the scope, structure and development of the annual hours worked of gainfully employed persons. The results and estimations of the AZR on working hours and volume of work are part of the short-term projections of the IAB on the labour market published twice a year as IAB Brief Reports (IAB-Kurzberichte).
The volume of work – that is, the overall number of hours worked in the economy in Germany – is determined conceptionally in a differentiated componentwise accounting concept. This means that calendar effects, collectively agreed standards (working hours and annual paid holidays), economic effects (short-time work, overtime and working time accounts), as well as person-related (sick leave and part-time work) and other miscellaneous components (labour disputes and multiple job holding), are considered separately. The data for these individual working time components have been obtained from a multitude of available official statistics and surveys. Their differences concerning the covered period, the type of survey, and the degree of coverage are taken into account in the calculation concept, for instance, via modern methods of time-series analysis. Moreover, the componentwise calculation also makes it possible to identify the contribution made by, and the importance of, these individual working time components for the overall development as a whole. Individual lengthening or shortening factors can thus be subjected to a separate analysis, their effect considered in isolation and their influence determined.
The quarterly published time series of the AZR on average working hours and volume of work of the employed are available in differentiated form
for employees or self-employed persons and family workers
by quarters since 1991 up to the present margin
in the so-called A21 breakdown according to the classification of economic activities, edition 2008 (WZ 2008)
for employees subdivided according to working time components as well as according to full-time, part-time and multiple job holding.
The publications are accompanied by IAB press releases.
In addition, the AZR's annual time series on average working hours and volume of work are also differentiated according to gender and age group. These results are available no earlier than nine months after the end of the respective reporting year.
Annotations on the data revision in the context of the 2025 Summer Calculations:
As part of the annual revision of the National Accounts of the Federal Statistical Office of Germany (Summer Calculations), the IAB has revised and updated the IAB Working Time Measurement Concept for the years from 2021. New data and methods were considered and the calculations for the period from 2021 onwards were redone accordingly.
Release Dates
Contact
The IAB’s regional labour market forecasts are set out in a series of tables below. The data includes the number of people in employment subject to social security contributions, the number of unemployed, the number of unemployed broken down by benefit system, the number of people able to work and eligible for benefits, and the unemployment rates at the level of the federal states and labour market districts. Until issue 1/2015, this forecast was published as ‘Regional labour market forecasts for the number of unemployed and the number of people in employment subject to social security contributions’. The figures are calculated by the Regional Research Network at the IAB.
Working from home (WFH) has become increasingly important as the growing availability of modern information and communication technologies enables many employees to decide where (and when) they work. As the occupations differ in terms of their WFH potential, we developed a new indicator for this, which we call ‘Home Office Potential (HOP)’. HOP indicates for each occupation, relative to all others, whether it is possible to set up a work environment other than the designated workplace. HOP, thus, complements other WFH indicators that based on the (subjective) assessments of respondents or on information on tasks performed at work.
Contact Data
HOP ISCO 4 Digit as HTML
ISCO084digit
UnitGroupEnglish
HOPI_raw_isco4
HOPII_raw_isco4
HOPI_norm_isco4
HOPII_norm_isco4
0110
Commissioned armed forces officers
0
0
0
0
0210
Non-commissioned armed forces officers
0
-1
0
0
0310
Armed forces occupations, other ranks
0
-1
0
0
1111
Legislators
0
0
1
1
1112
Senior government officials
0
0
1
1
1114
Senior officials of special-interest organizations
0
0
1
1
1120
Managing directors and chief executives
0
0
1
1
1211
Finance managers
0
0
1
1
1212
Human resource managers
0
1
1
1
1213
Policy and planning managers
0
0
0
1
1219
Business services and administration managers not elsewhere classified
0
0
0
1
1221
Sales and marketing managers
0
0
0
1
1222
Advertising and public relations managers
0
0
0
1
1223
Research and development managers
0
0
0
0
1312
Aquaculture and fisheries production managers
0
-1
0
0
1321
Manufacturing managers
0
0
0
0
1322
Mining managers
0
-1
0
0
1323
Construction managers
0
0
0
0
1324
Supply, distribution and related managers
0
0
0
1
1330
Information and communications technology service managers
0
0
0
1
1341
Child care service managers
0
0
1
1
1342
Health service managers
0
0
0
0
1343
Aged care service managers
0
0
0
1
1344
Social welfare managers
0
0
1
1
1345
Education managers
0
0
0
1
1346
Financial and insurance services branch managers
0
0
0
1
1349
Professional services managers not elsewhere classified
0
0
0
0
1411
Hotel managers
0
0
0
1
1412
Restaurant managers
0
0
0
1
1420
Retail and wholesale trade managers
0
0
1
1
1431
Sports, recreation and cultural centre managers
0
0
0
1
1439
Services managers not elsewhere classified
0
0
0
0
2111
Physicists and astronomers
0
0
0
0
2112
Meteorologists
0
0
0
0
2113
Chemists
0
0
0
0
2114
Geologists and geophysicists
0
0
0
0
2120
Mathematicians, actuaries and statisticians
0
1
1
1
2131
Biologists, botanists, zoologists and related professionals
0
0
0
0
2132
Farming, forestry and fisheries advisers
0
0
0
0
2133
Environmental protection professionals
0
0
0
1
2141
Industrial and production engineers
0
0
0
1
2142
Civil engineers
0
0
0
0
2143
Environmental engineers
0
0
0
0
2144
Mechanical engineers
0
0
0
0
2145
Chemical engineers
0
0
0
0
2146
Mining engineers, metallurgists and related professionals
0
0
0
0
2149
Engineering professionals not elsewhere classified
0
0
0
0
2151
Electrical engineers
0
0
0
0
2152
Electronics engineers
0
0
0
0
2153
Telecommunications engineers
0
0
0
0
2161
Building architects
0
0
0
0
2162
Landscape architects
0
0
0
0
2163
Product and garment designers
0
0
0
0
2164
Town and traffic planners
0
0
0
0
2165
Cartographers and surveyors
0
0
0
0
2166
Graphic and multimedia designers
0
0
1
1
2211
Generalist medical practitioners
0
0
0
0
2212
Specialist medical practitioners
0
0
0
0
2221
Nursing professionals
0
0
0
0
2222
Midwifery professionals
0
-1
0
0
2230
Traditional and complementary medicine professionals
0
-1
0
0
2240
Paramedical practitioners
0
-1
0
0
2250
Veterinarians
0
-1
0
0
2261
Dentists
0
0
0
0
2262
Pharmacists
0
0
0
1
2263
Environmental and occupational health and hygiene professionals
0
0
0
1
2264
Physiotherapists
0
0
0
0
2265
Dieticians and nutritionists
0
0
0
0
2266
Audiologists and speech therapists
0
0
0
0
2267
Optometrists and ophthalmic opticians
0
0
0
0
2269
Health professionals not elsewhere classified
0
0
0
0
2310
University and higher education teachers
0
0
1
1
2320
Vocational education teachers
0
0
0
1
2330
Secondary education teachers
0
0
0
1
2341
Primary school teachers
0
1
1
1
2342
Early childhood educators
0
0
0
0
2351
Education methods specialists
0
0
0
1
2352
Special needs teachers
0
0
0
1
2353
Other language teachers
0
1
1
1
2354
Other music teachers
0
0
0
1
2355
Other arts teachers
0
0
0
0
2356
Information technology trainers
0
0
0
1
2359
Teaching professionals not elsewhere classified
0
0
0
1
2411
Accountants
0
0
1
1
2412
Financial and investment advisers
0
0
1
1
2413
Financial analysts
0
0
1
1
2421
Management and organization analysts
0
0
1
1
2422
Policy administration professionals
0
0
1
1
2423
Personnel and careers professionals
0
0
1
1
2424
Training and staff development professionals
0
0
1
1
2431
Advertising and marketing professionals
0
0
1
1
2432
Public relations professionals
0
0
1
1
2433
Technical and medical sales professionals (excluding ICT)
0
0
0
1
2434
Information and communications technology sales professionals
0
0
1
1
2511
Systems analysts
0
0
1
1
2512
Software developers
0
0
0
1
2513
Web and multimedia developers
0
0
1
1
2514
Applications programmers
0
0
0
1
2519
Software and applications developers and analysts not elsewhere classified
0
0
1
1
2521
Database designers and administrators
0
1
1
1
2522
Systems administrators
0
0
1
1
2523
Computer network professionals
0
0
1
1
2529
Database and network professionals not elsewhere classified
0
0
1
1
2611
Lawyers
0
0
0
1
2612
Judges
0
0
0
1
2619
Legal professionals not elsewhere classified
0
0
0
1
2621
Archivists and curators
0
0
0
1
2622
Librarians and related information professionals
0
0
1
1
2631
Economists
0
0
1
1
2632
Sociologists, anthropologists and related professionals
0
0
0
1
2633
Philosophers, historians and political scientists
0
1
1
1
2634
Psychologists
0
0
0
1
2635
Social work and counselling professionals
0
0
0
1
2636
Religious professionals
0
0
0
0
2641
Authors and related writers
0
0
1
1
2642
Journalists
0
0
1
1
2643
Translators, interpreters and other linguists
0
0
1
1
2651
Visual artists
0
0
0
0
2652
Musicians, singers and composers
0
0
0
0
2653
Dancers and choreographers
0
-1
0
0
2654
Film, stage and related directors and producers
0
0
0
1
2655
Actors
0
-1
0
0
2656
Announcers on radio, television and other media
0
0
0
0
2659
Creative and performing artists not elsewhere classified
0
-1
0
0
3111
Chemical and physical science technicians
0
0
0
0
3112
Civil engineering technicians
0
0
0
0
3113
Electrical engineering technicians
0
0
0
0
3114
Electronics engineering technicians
0
0
0
0
3115
Mechanical engineering technicians
0
0
0
0
3116
Chemical engineering technicians
0
0
0
0
3117
Mining and metallurgical technicians
0
0
0
0
3118
Draughtspersons
0
0
1
1
3119
Physical and engineering science technicians not elsewhere classified
0
0
0
0
3121
Mining supervisors
0
0
0
0
3122
Manufacturing supervisors
0
0
0
0
3123
Construction supervisors
0
-1
0
0
3131
Power production plant operators
0
0
0
0
3132
Incinerator and water treatment plant operators
0
0
0
0
3133
Chemical processing plant controllers
0
0
0
0
3134
Petroleum and natural gas refining plant operators
0
0
0
0
3135
Metal production process controllers
0
-1
0
0
3139
Process control technicians not elsewhere classified
0
0
1
1
3141
Life science technicians (excluding medical)
0
-1
0
0
3142
Agricultural technicians
0
-1
0
0
3143
Forestry technicians
0
0
0
0
3151
Ships' engineers
0
-1
0
0
3152
Ships' deck officers and pilots
0
0
0
0
3153
Aircraft pilots and related associate professionals
0
0
0
0
3154
Air traffic controllers
0
0
0
0
3155
Air traffic safety electronics technicians
0
0
0
1
3211
Medical imaging and therapeutic equipment technicians
0
-1
0
0
3212
Medical and pathology laboratory technicians
0
-1
0
0
3213
Pharmaceutical technicians and assistants
0
-1
0
0
3214
Medical and dental prosthetic technicians
0
-1
0
0
3221
Nursing associate professionals
0
-1
0
0
3222
Midwifery associate professionals
0
-1
0
0
3240
Veterinary technicians and assistants
0
0
0
0
3251
Dental assistants and therapists
0
-1
0
0
3252
Medical records and health information technicians
0
0
1
1
3253
Community health workers
0
0
0
0
3254
Dispensing opticians
0
-1
0
0
3255
Physiotherapy technicians and assistants
0
-1
0
0
3256
Medical assistants
0
-1
0
0
3257
Environmental and occupational health inspectors and associates
0
0
0
0
3258
Ambulance workers
0
0
0
0
3259
Health associate professionals not elsewhere classified
0
0
0
0
3311
Securities and finance dealers and brokers
0
0
1
1
3312
Credit and loans officers
0
0
1
1
3313
Accounting associate professionals
0
1
1
1
3314
Statistical, mathematical and related associate professionals
0
0
1
1
3315
Valuers and loss assessors
0
0
0
1
3321
Insurance representatives
0
0
1
1
3322
Commercial sales representatives
0
0
1
1
3323
Buyers
0
0
1
1
3324
Trade brokers
0
0
1
1
3331
Clearing and forwarding agents
0
0
0
1
3332
Conference and event planners
0
0
0
1
3333
Employment agents and contractors
0
0
1
1
3334
Real estate agents and property managers
0
0
1
1
3339
Business services agents not elsewhere classified
0
0
1
1
3341
Office supervisors
0
0
1
1
3342
Legal secretaries
0
0
1
1
3343
Administrative and executive secretaries
0
0
1
1
3344
Medical secretaries
0
0
0
1
3351
Customs and border inspectors
0
0
0
0
3352
Government tax and excise officials
0
0
0
1
3353
Government social benefits officials
0
0
0
1
3354
Government licensing officials
0
0
0
1
3355
Police inspectors and detectives
0
0
0
0
3359
Government regulatory associate professionals not elsewhere classified
0
0
0
1
3411
Legal and related associate professionals
0
0
0
1
3412
Social work associate professionals
0
0
0
0
3413
Religious associate professionals
0
0
0
0
3421
Athletes and sports players
0
0
0
0
3422
Sports coaches, instructors and officials
0
0
0
0
3423
Fitness and recreation instructors and program leaders
0
0
0
0
3431
Photographers
0
0
0
0
3432
Interior designers and decorators
0
0
0
0
3433
Gallery, museum and library technicians
0
0
0
0
3434
Chefs
0
-1
0
0
3435
Artistic and cultural associate professionals not elsewhere classified
0
0
0
0
3511
Information and communications technology operations technicians
0
1
1
1
3512
Information and communications technology user support technicians
0
0
0
1
3513
Computer network and systems technicians
0
0
0
1
3514
Web technicians
0
1
1
1
3521
Broadcasting and audio-visual technicians
0
0
0
0
3522
Telecommunications engineering technicians
0
0
0
0
4110
General office clerks
0
0
1
1
4120
Secretaries (general)
0
0
1
1
4131
Typists and word processing operators
0
1
1
1
4132
Data entry clerks
0
0
0
1
4211
Bank tellers and related clerks
0
0
0
1
4212
Bookmakers, croupiers and related gaming workers
0
0
0
0
4213
Pawnbrokers and money-lenders
0
0
1
1
4214
Debt-collectors and related workers
0
0
0
1
4221
Travel consultants and clerks
0
0
0
1
4222
Contact centre information clerks
0
0
1
1
4223
Telephone switchboard operators
0
0
0
1
4224
Hotel receptionists
0
0
1
0
4225
Enquiry clerks
0
0
1
1
4226
Receptionists (general)
0
0
0
0
4227
Survey and market research interviewers
0
0
0
1
4229
Client information workers not elsewhere classified
0
0
1
1
4311
Accounting and bookkeeping clerks
0
0
1
1
4312
Statistical, finance and insurance clerks
0
0
1
1
4313
Payroll clerks
0
0
1
1
4321
Stock clerks
0
0
0
0
4322
Production clerks
0
0
1
1
4323
Transport clerks
0
0
0
1
4411
Library clerks
0
0
1
1
4412
Mail carriers and sorting clerks
0
-1
0
0
4413
Coding, proof-reading and related clerks
0
1
1
1
4415
Filing and copying clerks
0
0
1
1
4416
Personnel clerks
0
0
1
1
4419
Clerical support workers not elsewhere classified
0
0
1
1
5111
Travel attendants and travel stewards
0
0
0
0
5112
Transport conductors
0
0
0
0
5113
Travel guides
0
-1
0
0
5120
Cooks
0
-1
0
0
5131
Waiters
0
-1
0
0
5132
Bartenders
0
-1
0
0
5141
Hairdressers
0
-1
0
0
5142
Beauticians and related workers
0
-1
0
0
5151
Cleaning and housekeeping supervisors in offices, hotels and other establishments
0
0
0
0
5152
Domestic housekeepers
0
0
0
0
5153
Building caretakers
0
0
0
0
5161
Astrologers, fortune-tellers and related workers
0
0
0
0
5162
Companions and valets
0
-1
0
0
5163
Undertakers and embalmers
0
0
0
0
5164
Pet groomers and animal care workers
0
-1
0
0
5165
Driving instructors
0
0
0
0
5169
Personal services workers not elsewhere classified
0
-1
0
0
5211
Stall and market salespersons
0
-1
0
0
5212
Street food salespersons
0
-1
0
0
5221
Shopkeepers
0
0
0
0
5222
Shop supervisors
0
0
1
1
5223
Shop sales assistants
0
0
0
0
5230
Cashiers and ticket clerks
0
0
0
0
5241
Fashion and other models
0
-1
0
0
5242
Sales demonstrators
0
-1
0
0
5243
Door to door salespersons
0
-1
0
0
5244
Contact centre salespersons
0
0
1
1
5245
Service station attendants
0
-1
0
0
5246
Food service counter attendants
0
-1
0
0
5249
Sales workers not elsewhere classified
0
0
1
1
5311
Child care workers
0
-1
0
0
5312
Teachers' aides
0
0
1
1
5321
Health care assistants
0
-1
0
0
5322
Home-based personal care workers
0
-1
0
0
5329
Personal care workers in health services not elsewhere classified
0
-1
0
0
5411
Firefighters
0
0
0
0
5412
Police officers
0
0
0
0
5413
Prison guards
0
0
0
0
5414
Security guards
0
0
0
0
5419
Protective services workers not elsewhere classified
0
-1
0
0
6111
Field crop and vegetable growers
0
-1
0
0
6112
Tree and shrub crop growers
0
-1
0
0
6113
Gardeners, horticultural and nursery growers
0
-1
0
0
6121
Livestock and dairy producers
0
-1
0
0
6122
Poultry producers
0
-1
0
0
6123
Apiarists and sericulturists
0
-1
0
0
6129
Animal producers not elsewhere classified
0
-1
0
0
6130
Mixed crop and animal producers
0
-1
0
0
6210
Forestry and related workers
0
-1
0
0
6221
Aquaculture workers
0
-1
0
0
6222
Inland and coastal waters fishery workers
0
-1
0
0
6223
Deep-sea fishery workers
0
-1
0
0
7111
House builders
0
-1
0
0
7112
Bricklayers and related workers
0
-1
0
0
7113
Stonemasons, stone cutters, splitters and carvers
0
-1
0
0
7114
Concrete placers, concrete finishers and related workers
0
-1
0
0
7115
Carpenters and joiners
0
-1
0
0
7119
Building frame and related trades workers not elsewhere classified
0
-1
0
0
7121
Roofers
0
-1
0
0
7122
Floor layers and tile setters
0
-1
0
0
7123
Plasterers
0
-1
0
0
7124
Insulation workers
0
-1
0
0
7125
Glaziers
0
-1
0
0
7126
Plumbers and pipe fitters
0
-1
0
0
7127
Air conditioning and refrigeration mechanics
0
-1
0
0
7131
Painters and related workers
0
-1
0
0
7132
Spray painters and varnishers
0
-1
0
0
7133
Building structure cleaners
0
-1
0
0
7211
Metal molders and core makers
0
-1
0
0
7212
Welders and flame cutters
0
-1
0
0
7213
Sheet metal workers
0
-1
0
0
7214
Structural metal preparers and erectors
0
-1
0
0
7221
Blacksmiths, hammer smiths and forging press workers
0
-1
0
0
7222
Toolmakers and related workers
0
-1
0
0
7223
Metal working machine tool setters and operators
0
-1
0
0
7224
Metal polishers, wheel grinders and tool sharpeners
0
-1
0
0
7231
Motor vehicle mechanics and repairers
0
-1
0
0
7232
Aircraft engine mechanics and repairers
0
-1
0
0
7233
Agricultural and industrial machinery mechanics and repairers
0
-1
0
0
7234
Bicycle and related repairers
0
-1
0
0
7311
Precision-instrument makers and repairers
0
-1
0
0
7312
Musical instrument makers and tuners
0
-1
0
0
7313
Jewellery and precious metal workers
0
-1
0
0
7314
Potters and related workers
0
-1
0
0
7315
Glass makers, cutters, grinders and finishers
0
-1
0
0
7316
Sign writers, decorative painters, engravers and etchers
0
-1
0
0
7317
Handicraft workers in wood, basketry and related materials
0
-1
0
0
7318
Handicraft workers in textile, leather and related materials
0
0
0
0
7319
Handicraft workers not elsewhere classified
0
-1
0
0
7321
Pre-press technicians
0
0
1
1
7322
Printers
0
-1
0
0
7323
Print finishing and binding workers
0
-1
0
0
7411
Building and related electricians
0
-1
0
0
7412
Electrical mechanics and fitters
0
-1
0
0
7413
Electrical line installers and repairers
0
-1
0
0
7421
Electronics mechanics and servicers
0
-1
0
0
7422
Information and communications technology installers and servicers
0
-1
0
0
7511
Butchers, fishmongers and related food preparers
0
-1
0
0
7512
Bakers, pastry-cooks and confectionery makers
0
-1
0
0
7513
Dairy products makers
0
-1
0
0
7514
Fruit, vegetable and related preservers
0
-1
0
0
7515
Food and beverage tasters and graders
0
-1
0
0
7516
Tobacco preparers and tobacco products makers
0
-1
0
0
7521
Wood treaters
0
-1
0
0
7522
Cabinet-makers and related workers
0
-1
0
0
7523
Woodworking machine tool setters and operators
0
-1
0
0
7531
Tailors, dressmakers, furriers and hatters
0
-1
0
0
7532
Garment and related patternmakers and cutters
0
0
0
0
7533
Sewing, embroidery and related workers
0
-1
0
0
7534
Upholsterers and related workers
0
-1
0
0
7535
Pelt dressers, tanners and fellmongers
0
-1
0
0
7536
Shoemakers and related workers
0
-1
0
0
7541
Underwater divers
0
-1
0
0
7542
Shotfirers and blasters
0
0
0
0
7543
Product graders and testers (except foods and beverages)
0
0
0
0
7544
Fumigators and other pest and weed controllers
0
-1
0
0
7549
Craft and related workers not elsewhere classified
0
-1
0
0
8111
Miners and quarriers
0
-1
0
0
8112
Mineral and stone processing plant operators
0
-1
0
0
8113
Well drillers and borers and related workers
0
-1
0
0
8114
Cement, stone and other mineral products machine operators
0
-1
0
0
8121
Metal processing plant operators
0
-1
0
0
8122
Metal finishing, plating and coating machine operators
0
-1
0
0
8131
Chemical products plant and machine operators
0
-1
0
0
8132
Photographic products machine operators
0
0
0
0
8141
Rubber products machine operators
0
-1
0
0
8142
Plastic products machine operators
0
-1
0
0
8143
Paper products machine operators
0
-1
0
0
8151
Fibre preparing, spinning and winding machine operators
0
-1
0
0
8152
Weaving and knitting machine operators
0
-1
0
0
8153
Sewing machine operators
0
-1
0
0
8154
Bleaching, dyeing and fabric cleaning machine operators
0
-1
0
0
8155
Fur and leather preparing machine operators
0
-1
0
0
8156
Shoemaking and related machine operators
0
-1
0
0
8157
Laundry machine operators
0
-1
0
0
8159
Textile, fur and leather products machine operators not elsewhere classified
0
-1
0
0
8160
Food and related products machine operators
0
-1
0
0
8171
Pulp and papermaking plant operators
0
-1
0
0
8172
Wood processing plant operators
0
-1
0
0
8181
Glass and ceramics plant operators
0
-1
0
0
8182
Steam engine and boiler operators
0
-1
0
0
8183
Packing, bottling and labelling machine operators
0
-1
0
0
8189
Stationary plant and machine operators not elsewhere classified
0
-1
0
0
8211
Mechanical machinery assemblers
0
-1
0
0
8212
Electrical and electronic equipment assemblers
0
-1
0
0
8219
Assemblers not elsewhere classified
0
-1
0
0
8311
Locomotive engine drivers
0
0
0
0
8312
Railway brake, signal and switch operators
0
0
0
0
8321
Motorcycle drivers
0
0
0
0
8322
Car, taxi and van drivers
0
0
0
0
8331
Bus and tram drivers
0
-1
0
0
8332
Heavy truck and lorry drivers
0
-1
0
0
8341
Mobile farm and forestry plant operators
0
-1
0
0
8342
Earthmoving and related plant operators
0
-1
0
0
8343
Crane, hoist and related plant operators
0
-1
0
0
8344
Lifting truck operators
0
-1
0
0
8350
Ships' deck crews and related workers
0
-1
0
0
9111
Domestic cleaners and helpers
0
-1
0
0
9112
Cleaners and helpers in offices, hotels and other establishments
0
-1
0
0
9122
Vehicle cleaners
0
-1
0
0
9123
Window cleaners
0
-1
0
0
9129
Other cleaning workers
0
-1
0
0
9211
Crop farm labourers
0
-1
0
0
9212
Livestock farm labourers
0
-1
0
0
9213
Mixed crop and livestock farm labourers
0
-1
0
0
9214
Garden and horticultural labourers
0
-1
0
0
9215
Forestry labourers
0
-1
0
0
9216
Fishery and aquaculture labourers
0
-1
0
0
9311
Mining and quarrying labourers
0
-1
0
0
9312
Civil engineering labourers
0
-1
0
0
9313
Building construction labourers
0
-1
0
0
9321
Hand packers
0
-1
0
0
9329
Manufacturing labourers not elsewhere classified
0
-1
0
0
9331
Hand and pedal vehicle drivers
0
0
0
0
9332
Drivers of animal-drawn vehicles and machinery
0
-1
0
0
9333
Freight handlers
0
-1
0
0
9334
Shelf fillers
0
-1
0
0
9411
Fast food preparers
0
-1
0
0
9412
Kitchen helpers
0
-1
0
0
9611
Garbage and recycling collectors
0
-1
0
0
9612
Refuse sorters
0
-1
0
0
9613
Sweepers and related labourers
0
-1
0
0
9621
Messengers, package deliverers and luggage porters
0
0
0
0
9623
Meter readers and vending-machine collectors
0
-1
0
0
9629
Elementary workers not elsewhere classified
0
0
0
0
HOP KldB 2010 5 Digit as HTML
Kldb2010_5
Occupational_category
HOPI_raw_bkz5
HOPII_raw_bkz5
HOPI_norm_bkz5
HOPII_norm_bkz5
01104
Commissioned officers
0
0
0
0
01203
Senior non-commissioned officers and higher
0
0
0
0
01302
Junior non-commissioned officers
0
-1
0
0
01402
Armed forces personnel in other ranks
0
-1
0
0
11101
Occupations in farming (without specialisation)-unskilled/semiskilled tasks
0
-1
0
0
11102
Occupations in farming (without specialisation)-skilled tasks
0
-1
0
0
11103
Occupations in farming (without specialisation)-complex tasks
0
0
0
1
11104
Occupations in farming (without specialisation)-highly complex tasks
0
0
0
0
11113
Technical occupations in farming-complex tasks
0
-1
0
0
11114
Technical occupations in farming-highly complex tasks
0
-1
0
0
11123
Agricultural experts-complex tasks
0
0
0
1
11124
Agricultural experts-high complex tasks
0
0
0
1
11132
Technical laboratory occupations in agriculture-skilled tasks
0
-1
0
0
11133
Technical laboratory occupations in agriculture-complex tasks
0
-1
0
0
11182
Occupations in farming (with specialisation, not elsewhere classified)-skilled tasks
0
-1
0
0
11183
Occupations in farming (with specialisation, not elsewhere classified)-complex tasks
0
0
0
1
11184
Occupations in farming (with specialisation, not elsewhere classified)-highly complex tasks
0
-1
0
0
11193
Supervisors in farming
0
-1
0
0
11194
Managers in farming
0
0
0
0
11211
Occupations in livestock farming (without poultry farming)-unskilled/semiskilled tasks
0
-1
0
0
11212
Occupations in livestock farming (without poultry farming)-skilled tasks
0
-1
0
0
11213
Occupations in livestock farming (without poultry farming)-complex tasks
0
-1
0
0
11214
Occupations in livestock farming (without poultry farming)-highly complex tasks
0
-1
0
0
11222
Occupations in poultry farming-skilled tasks
0
-1
0
0
11223
Occupations in poultry farming-complex tasks
0
-1
0
0
11232
Occupations in beekeeping-skilled tasks
0
-1
0
0
11233
Occupations in beekeeping-complex tasks
0
-1
0
0
11282
Occupations in animal husbandry (with specialisation, not elsewhere classified)-skilled tasks
0
-1
0
0
11283
Occupations in animal husbandry (with specialisation, not elsewhere classified)-complex tasks
0
-1
0
0
11293
Supervisors in animal husbandry
0
-1
0
0
11294
Managers in animal husbandry
0
0
0
0
11302
Occupations in horsekeeping (without specialisation)-skilled tasks
0
-1
0
0
11312
Occupations in horse breeding-skilled tasks
0
-1
0
0
11322
Occupations in horsekeeping: riding-skilled tasks
0
-1
0
0
11333
Farrier-complex tasks
0
-1
0
0
11342
Coachman-skilled tasks
0
-1
0
0
11393
Supervisors in horsekeeping
0
0
0
0
11394
Managers in horsekeeping
0
0
0
0
11401
Occupations in fishing (without specialisation)-unskilled/semiskilled tasks
0
-1
0
0
11402
Occupations in fishing (without specialisation)-skilled tasks
0
-1
0
0
11412
Occupations in fish farming-skilled tasks
0
-1
0
0
11422
Occupations in fishery-skilled tasks
0
-1
0
0
11423
Occupations in fishery-complex tasks
0
-1
0
0
11424
Occupations in fishery-highly complex tasks
0
-1
0
0
11493
Supervisors in fishing
0
-1
0
0
11494
Managers in fishing
0
-1
0
0
11501
Occupations in animal care (without specialisation)-unskilled/semiskilled tasks
0
-1
0
0
11502
Occupations in animal care (without specialisation)-skilled tasks
0
-1
0
0
11512
Occupations in livestock care-skilled tasks
0
-1
0
0
11522
Occupations in pet and zoo animal care-skilled tasks
0
-1
0
0
11582
Occupations in animal care (with specialisation, not elsewhere classified)-skilled tasks
0
-1
0
0
11593
Supervisors in animal care
0
-1
0
0
11594
Managers in animal care
0
0
0
0
11602
Occupations in vini- and viticulture-skilled tasks
0
-1
0
0
11603
Occupations in vini- and viticulture-complex tasks
0
-1
0
0
11604
Occupations in vini- and viticulture-highly complex tasks
0
0
0
0
11693
Supervisors in vini- and viticulture
0
-1
0
0
11694
Managers in vini- and viticulture
0
-1
0
0
11711
Occupations in forestry-unskilled/semiskilled tasks
0
-1
0
0
11712
Occupations in forestry-skilled tasks
0
-1
0
0
11713
Occupations in forestry-complex tasks
0
0
0
0
11714
Occupations in forestry-highly complex tasks
0
0
0
1
11722
Occupations in landscape preservation-skilled tasks
0
-1
0
0
11723
Occupations in landscape preservation-complex tasks
0
0
0
0
11724
Occupations in landscape preservation-highly complex tasks
0
0
0
0
11732
Occupations in hunting and gamekeeping-skilled tasks
0
-1
0
0
11742
Picking and extracting plants and other natural products-skilled tasks
0
-1
0
0
11793
Supervisors in forestry, hunting and landscape preservation
0
-1
0
0
11794
Managers in forestry, hunting and landscape preservation
0
0
0
0
12101
Occupations in gardening (without specialisation)-unskilled/semiskilled tasks
0
-1
0
0
12102
Occupations in gardening (without specialisation)-skilled tasks
0
-1
0
0
12103
Occupations in gardening (without specialisation)-complex tasks
0
-1
0
0
12104
Occupations in gardening (without specialisation)-highly complex tasks
0
0
0
0
12112
Occupations in fruit and vegetable farming-skilled tasks
0
-1
0
0
12113
Occupations in fruit and vegetable farming-complex tasks
0
-1
0
0
12122
Occupations in tree, perennial and ornamental plants farming-skilled tasks
0
-1
0
0
12123
Occupations in tree, perennial and ornamental plants farming-complex tasks
0
-1
0
0
12132
Occupations in cemetery gardening-skilled tasks
0
-1
0
0
12133
Occupations in cemetery gardening-complex tasks
0
-1
0
0
12142
Occupations in horticulture, landscape gardening, and sports field maintenance-skilled tasks
0
-1
0
0
12143
Occupations in horticulture, landscape gardening, and sports field maintenance-complex tasks
0
0
0
0
12144
Occupations in horticulture, landscape gardening, and sports field maintenance-highly complex tasks
0
0
0
0
12193
Supervisors in gardening
0
-1
0
0
12194
Managers in gardening
0
-1
0
0
12202
Occupations in floristry-skilled tasks
0
-1
0
0
12203
Occupations in floristry-complex tasks
0
0
0
0
12293
Supervisors in floristry
0
0
0
0
12294
Managers in floristry
0
0
0
0
21111
Occupations in underground and surface mining-unskilled/semiskilled tasks
0
-1
0
0
21112
Occupations in underground and surface mining-skilled tasks
0
-1
0
0
21113
Occupations in underground and surface mining-complex tasks
0
0
0
0
21114
Occupations in underground and surface mining-highly complex tasks
0
0
0
0
21122
Occupations in blasting engineering-skilled tasks
0
-1
0
0
21123
Occupations in blasting engineering-complex tasks
0
0
0
0
21124
Occupations in blasting engineering-highly complex tasks
0
0
0
0
21193
Supervisors in underground and surface mining and blasting engineering
0
0
0
0
21194
Managers in underground and surface mining and blasting engineering
0
-1
0
0
21201
Conditioning and processing of natural stone and minerals, production of building materials (without specialisation)-unskilled/semiskilled tasks
0
-1
0
0
21212
Conditioning and processing of natural stone and minerals-skilled tasks
0
-1
0
0
21213
Conditioning and processing of natural stone and minerals-complex tasks
0
0
0
0
21222
Production of building materials-skilled tasks
0
-1
0
0
21223
Production of building materials-complex tasks
0
0
0
0
21232
Occupations in stonemasonry-skilled tasks
0
-1
0
0
21233
Occupations in stonemasonry-complex tasks
0
0
0
0
21293
Supervisors in conditioning and processing of natural stone and minerals, production of building materials
0
-1
0
0
21311
Occupations in glass-making-unskilled/semiskilled tasks
0
-1
0
0
21312
Occupations in glass-making-skilled tasks
0
-1
0
0
21313
Occupations in glass-making-complex tasks
0
-1
0
0
21322
Manufacturing of glass instruments engineering-skilled tasks
0
-1
0
0
21323
Manufacturing of glass instruments engineering-complex tasks
0
-1
0
0
21332
Occupations in industrial glassblowing-skilled tasks
0
-1
0
0
21342
Occupations in glass finishing-skilled tasks
0
-1
0
0
21352
Occupations in adjusting of glass instruments-skilled tasks
0
-1
0
0
21362
Occupations in precision optics-skilled tasks
0
-1
0
0
21363
Occupations in precision optics-complex tasks
0
-1
0
0
21393
Supervisors in industrial glass-making and -processing
0
0
0
0
21411
Occupations in industrial process and plant engineering for ceramic materials-unskilled/semiskilled tasks
0
-1
0
0
21412
Occupations in industrial process and plant engineering for ceramic materials-skilled tasks
0
-1
0
0
21413
Occupations in industrial process and plant engineering for ceramic materials-complex tasks
0
0
0
0
21422
Occupations in industrial ceramic model making-skilled tasks
0
-1
0
0
21423
Occupations in industrial ceramic model making-complex tasks
0
0
0
0
21493
Supervisors in industrial ceramic-making and -processing
0
-1
0
0
22101
Occupations in plastic- and rubber-making (without specialisation)-unskilled/semiskilled tasks
0
-1
0
0
22102
Occupations in plastic- and rubber-making (without specialisation)-skilled tasks
0
-1
0
0
22103
Occupations in plastic- and rubber-making (without specialisation)-complex tasks
0
0
0
0
22104
Occupations in plastic- and rubber-making (without specialisation)-highly complex tasks
0
0
0
0
22112
Technical occupations in tire production and vulcanisation-skilled tasks
0
-1
0
0
22182
Occupations in plastic- and rubber-making and -processing (with specialisation, not elsewhere classified)-skilled tasks
0
-1
0
0
22183
Occupations in plastic- and rubber-making and -processing (with specialisation, not elsewhere classified)-complex tasks
0
0
0
0
22184
Occupations in plastic- and rubber-making and -processing (with specialisation, not elsewhere classified)-highly complex tasks
0
0
0
0
22193
Supervisors in plastic- and rubber-making and -processing
0
-1
0
0
22201
Occupations in colour coating and varnishing (without specialisation)-unskilled/semiskilled tasks
0
-1
0
0
22202
Occupations in colour coating and varnishing (without specialisation)-skilled tasks
0
-1
0
0
22203
Occupations in colour coating and varnishing (without specialisation)-complex tasks
0
0
0
0
22204
Occupations in colour coating and varnishing (without specialisation)-highly complex tasks
0
0
0
0
22212
Vehicle paintwork-skilled tasks
0
-1
0
0
22222
Occupations in varnishing laboratories-skilled tasks
0
-1
0
0
22293
Supervisors in colour coating and varnishing
0
0
0
1
22301
Occupations in wood-working and -processing (without specialisation)-unskilled/semiskilled tasks
0
-1
0
0
22302
Occupations in wood-working and -processing (without specialisation)-skilled tasks
0
-1
0
0
22303
Occupations in wood-working and -processing (without specialisation)-complex tasks
0
0
0
0
22304
Occupations in wood-working and -processing (without specialisation)-highly complex tasks
0
0
0
0
22312
Occupations in wood drying and preservation-skilled tasks
0
-1
0
0
22322
Occupations producing wood-based materials and wooden components-skilled tasks
0
-1
0
0
22332
Occupations producing finished products from wood and wood-based materials-skilled tasks
0
-1
0
0
22333
Occupations producing finished products from wood and wood-based materials-complex tasks
0
0
0
0
22342
Occupations in wood construction, furniture and cabinet making, and interior finishing-skilled tasks
0
-1
0
0
22343
Occupations in wood construction, furniture and cabinet making, and interior finishing-complex tasks
0
0
0
0
22352
Wickerwork manufacturers, broom and brush makers-skilled tasks
0
-1
0
0
22382
Occupations in wood-working and -processing (with specialisation, not elsewhere classified)-skilled tasks
0
-1
0
0
22393
Supervisors in wood-working and -processing
0
0
0
0
22394
Managers in wood-working and -processing
0
0
0
0
23101
Technical occupations in paper-making and -processing and packaging (without specialisation)-unskilled/semiskilled tasks
0
-1
0
0
23112
Occupations in paper-making (without specialisation)-skilled tasks
0
-1
0
0
23113
Occupations in paper-making (without specialisation)-complex tasks
0
0
0
0
23114
Occupations in paper-making (without specialisation)-highly complex tasks
0
0
0
0
23122
Occupations in paper-processing and packaging-skilled tasks
0
-1
0
0
23123
Occupations in paper-processing and packaging-complex tasks
0
0
0
1
23124
Occupations in paper-processing and packaging-highly complex tasks
0
0
0
0
23193
Supervisors in paper-making and -processing and packaging
0
0
0
0
23212
Occupations in digital and print media design-skilled tasks
0
0
1
1
23213
Occupations in digital and print media design-complex tasks#
0
0
1
1
23222
Occupations in graphic, communication, and photo design-skilled tasks
0
0
0
1
23223
Occupations in graphic, communication, and photo design-complex tasks
0
0
0
1
23224
Occupations in graphic, communication, and photo design-highly complex tasks
0
0
0
1
23282
Occupations in technical media design (with specialisation, not elsewhere classified)-skilled tasks
0
0
0
0
23293
Supervisors in technical media design
0
0
0
0
23294
Managers in technical media design
0
0
0
1
23312
Occupations in photographic technology-skilled tasks
0
0
0
0
23313
Occupations in photographic technology-complex tasks
0
0
0
0
23314
Occupations in photographic technology-highly complex tasks
0
0
0
1
23322
Occupations in photography-skilled tasks
0
0
0
0
23393
Supervisors in photography and photographic technology
0
0
0
0
23411
Occupations in printing technology-unskilled/semiskilled tasks
0
-1
0
0
23412
Occupations in printing technology-skilled tasks
0
-1
0
0
23413
Occupations in printing technology-complex tasks
0
0
0
0
23414
Occupations in printing technology-highly complex tasks
0
0
0
0
23422
Occupations in book binding and print finishing-skilled tasks
0
-1
0
0
23423
Occupations in book binding and print finishing-complex tasks
0
0
0
0
23493
Supervisors in printing technology, print finishing, and book binding
0
0
0
0
24101
Occupations in metal-making (without specialisation)-unskilled/semiskilled tasks
0
-1
0
0
24112
Occupations in metallurgy-skilled tasks
0
-1
0
0
24113
Occupations in metallurgy-complex tasks
0
-1
0
0
24114
Occupations in metallurgy-highly complex tasks
0
0
0
0
24122
Occupations in metal moulding-skilled tasks
0
-1
0
0
24123
Occupations in metal moulding-complex tasks
0
-1
0
0
24124
Occupations in metal moulding-highly complex tasks
0
0
0
0
24132
Occupations in industrial metal casting-skilled tasks
0
-1
0
0
24133
Occupations in industrial metal casting-complex tasks
0
-1
0
0
24134
Occupations in industrial metal casting -highly complex tasks
0
0
0
0
24142
Occupations in manual metal and bell founding-skilled tasks
0
-1
0
0
24193
Supervisors in metal-making
0
-1
0
0
24201
Occupations in metalworking (without specialisation)-unskilled/semiskilled tasks
0
-1
0
0
24202
Occupations in metalworking (without specialisation)-skilled tasks
0
-1
0
0
24203
Occupations in metalworking (without specialisation)-complex tasks
0
0
0
0
24212
Occupations in metalworking: non-cutting-skilled tasks
0
-1
0
0
24222
Occupations in metalworking: grinding-skilled tasks
0
-1
0
0
24232
Occupations in metalworking: cutting-skilled tasks
0
-1
0
0
24233
Occupations in metalworking: cutting-complex tasks
0
0
0
0
24243
Occupations in laser-assisted metalworking-complex tasks
0
-1
0
0
24244
Occupations in laser-assisted metalworking-highly complex tasks
0
-1
0
0
24293
Supervisors in metalworking
0
0
0
0
24301
Occupations in treatment of metal surfaces (without specialisation)-unskilled/semiskilled tasks
0
-1
0
0
24302
Occupations in treatment of metal surfaces (without specialisation)-skilled tasks
0
-1
0
0
24303
Occupations in treatment of metal surfaces (without specialisation)-complex tasks
0
0
0
0
24304
Occupations in treatment of metal surfaces (without specialisation)-highly complex tasks
0
-1
0
0
24382
Occupations in treatment of metal surfaces (with specialisation, not elsewhere classified)-skilled tasks
0
-1
0
0
24393
Supervisors in treatment of metal surfaces
0
-1
0
0
24411
Occupations in metal constructing-unskilled/semiskilled tasks
0
-1
0
0
24412
Occupations in metal constructing-skilled tasks
0
-1
0
0
24413
Occupations in metal constructing-complex tasks
0
0
0
0
24414
Occupations in metal constructing-highly complex tasks
0
0
0
0
24422
Occupations in welding and joining-skilled tasks
0
-1
0
0
24423
Occupations in welding and joining-complex tasks
0
-1
0
0
24424
Occupations in welding and joining-highly complex tasks
0
-1
0
0
24432
Industrial divers and other diving occupations-skilled tasks
0
-1
0
0
24493
Supervisors in metal constructing and welding
0
0
0
0
24511
Occupations in precision mechanics-unskilled/semiskilled tasks
0
-1
0
0
24512
Occupations in precision mechanics-skilled tasks
0
-1
0
0
24513
Occupations in precision mechanics-complex tasks
0
0
0
0
24514
Occupations in precision mechanics-highly complex tasks
0
0
0
0
24522
Occupations in tool making-skilled tasks
0
-1
0
0
24523
Occupations in tool making-complex tasks
0
0
0
0
24524
Occupations in tool making-highly complex tasks
0
0
0
0
24532
Occupations in watchmaking- skilled tasks
0
-1
0
0
24533
Occupations in watchmaking-complex tasks
0
0
0
0
24593
Supervisors in precision mechanics and tool making
0
0
0
0
25101
Occupations in machine-building and -operating (without specialisation)-unskilled/semiskilled tasks
0
-1
0
0
25102
Occupations in machine-building and -operating (without specialisation)-skilled tasks
0
-1
0
0
25103
Occupations in machine-building and -operating (without specialisation)-complex tasks
0
0
0
0
25104
Occupations in machine-building and -operating (without specialisation)-highly complex tasks
0
0
0
0
25112
Machine and equipment assemblers-skilled tasks
0
-1
0
0
25122
Machine and plant operators-skilled tasks
0
-1
0
0
25131
Technical service staff in maintenance and repair-unskilled/semiskilled tasks
0
-1
0
0
25132
Technical service staff in maintenance and repair-skilled tasks
0
-1
0
0
25133
Technical service staff in maintenance and repair-complex tasks
0
-1
0
0
25134
Technical service staff in maintenance and repair-highly complex tasks
0
0
0
0
25182
Occupations in machine-building and -operating (with specialisation, not elsewhere classified)-skilled tasks
0
-1
0
0
25183
Occupations in machine-building and -operating (with specialisation, not elsewhere classified)-complex tasks
0
0
0
0
25184
Occupations in machine-building and -operating (with specialisation, not elsewhere classified)-highly complex tasks
0
0
0
0
25193
Supervisors in machine-building and -operating
0
0
0
0
25194
Managers in machine-building and -operating
0
0
0
1
25201
Technical occupations in the automotive industries (without specialisation)-unskilled/semiskilled tasks
0
-1
0
0
25212
Technical occupations in the automotive industries-skilled tasks
0
-1
0
0
25213
Technical occupations in the automotive industries-complex tasks
0
-1
0
0
25214
Technical occupations in the automotive industries-highly complex tasks
0
0
0
1
25222
Technical occupations, agricultural and construction machinery-skilled tasks
0
-1
0
0
25223
Technical occupations, agricultural and construction machinery-complex tasks
0
-1
0
0
25224
Technical occupations, agricultural and construction machinery-highly complex tasks
0
0
0
0
25232
Technical occupations in the aeronautic and aerospace industries-skilled tasks
0
-1
0
0
25233
Technical occupations in the aeronautic and aerospace industries-complex tasks
0
-1
0
0
25234
Technical occupations in the aeronautic and aerospace industries-highly complex tasks
0
0
0
0
25242
Technical occupations in ship building-skilled tasks
0
-1
0
0
25243
Technical occupations in ship building-complex tasks
0
-1
0
0
25244
Technical occupations in ship building-highly complex tasks
0
0
0
0
25252
Technical occupations in the maintenance and construction of bicycles and motorbikes-skilled tasks
0
-1
0
0
25253
Technical occupations in the maintenance and construction of bicycles and motorbikes-complex tasks
0
-1
0
0
25254
Technical occupations in the maintenance and construction of bicycles and motorbikes-highly complex tasks
0
0
0
1
25293
Supervisors in the automotive, aeronautic, aerospace and ship building industries
0
0
0
0
25294
Managers in the automotive, aeronautic, aerospace and ship building industries
0
0
0
1
26112
Occupations in mechatronics-skilled tasks
0
-1
0
0
26113
Occupations in mechatronics-complex tasks
0
0
0
0
26114
Occupations in mechatronics-highly complex tasks
0
0
0
0
26122
Occupations in automation and control technology-skilled tasks
0
-1
0
0
26123
Occupations in automation and control technology-complex tasks
0
0
0
0
26124
Occupations in automation and control technology-highly complex tasks
0
0
0
0
26193
Supervisors in mechatronics and automation and control technology
0
0
0
0
26212
Electricians in construction-skilled tasks
0
-1
0
0
26222
Technical occupations in maintenance of electric machines-skilled tasks
0
-1
0
0
26223
Technical occupations in maintenance of electric machines-complex tasks
0
0
0
0
26232
Technical occupations in energy and power plant technology-skilled tasks
0
-1
0
0
26233
Technical occupations in energy and power plant technology-complex tasks
0
0
0
0
26234
Technical occupations in energy and power plant technology-highly complex tasks
0
0
0
0
26242
Occupations in renewable energy technology-skilled tasks
0
-1
0
0
26243
Occupations in renewable energy technology-complex tasks
0
0
0
0
26244
Occupations in renewable energy technology-highly complex tasks
0
0
0
0
26252
Occupations in installing and maintaining electrical machines and equipment in plants-skilled tasks
0
-1
0
0
26253
Occupations in installing and maintaining electrical machines and equipment in plants-complex tasks
0
0
0
0
26262
Occupations in installing and servicing electrical cables-skilled tasks
0
-1
0
0
26263
Occupations in installing and servicing electrical cables-complex tasks
0
0
0
0
26264
Occupations in installing and servicing electrical cables-highly complex tasks
0
0
0
0
26293
Supervisors in energy technology
0
0
0
0
26301
Occupations in electrical engineering (without specialisation)-unskilled/semiskilled tasks
0
-1
0
0
26302
Occupations in electrical engineering (without specialisation)-skilled tasks
0
-1
0
0
26303
Occupations in electrical engineering (without specialisation)-complex tasks
0
0
0
0
26304
Occupations in electrical engineering (without specialisation)-highly complex tasks
0
0
0
0
26312
Occupations in information and telecommunication technology-skilled tasks
0
0
0
0
26313
Occupations in information and telecommunication technology-complex tasks
0
0
0
0
26314
Occupations in information and telecommunication technology-highly complex tasks
0
0
0
0
26322
Occupations in microsystems technology-skilled tasks
0
-1
0
0
26323
Occupations in microsystems technology-complex tasks
0
0
0
0
26324
Occupations in microsystems technology-highly complex tasks
0
0
0
0
26332
Occupations in aeronautic, naval, and automotive electronics-skilled tasks
0
-1
0
0
26333
Occupations in in aeronautic, naval, and automotive electronics-complex tasks
0
0
0
0
26334
Occupations in in aeronautic, naval, and automotive electronics-highly complex tasks
0
0
0
0
26382
Occupations in electrical engineering (with specialisation, not elsewhere classified)-skilled tasks
0
-1
0
0
26383
Occupations in electrical engineering (with specialisation, not elsewhere classified)-complex tasks
0
0
0
0
26384
Occupations in electrical engineering (with specialisation, not elsewhere classified)-highly complex tasks
0
0
0
0
26393
Supervisors in electrical engineering
0
0
0
0
27103
Occupations in technical research and development (without specialisation)-complex tasks
0
0
0
1
27104
Occupations in technical research and development (without specialisation)-highly complex tasks
0
0
0
1
27182
Occupations in technical research and development (with specialisation, not elsewhere classified)-skilled tasks
0
0
0
1
27183
Occupations in technical research and development (with specialisation, not elsewhere classified)-complex tasks
0
0
0
0
27184
Occupations in technical research and development (with specialisation, not elsewhere classified)-highly complex tasks
0
0
0
1
27194
Managers in technical research and development
0
0
0
0
27212
Draftspersons-skilled tasks
0
0
1
1
27223
Occupations in technical design and apparatus building-complex tasks
0
0
1
1
27224
Occupations in technical design and apparatus building-highly complex tasks
0
0
0
0
27232
Model makers-skilled tasks
0
-1
0
0
27282
Technical draftspersons, engineering designers and model makers (with specialisation, not elsewhere classified)-skilled tasks
0
-1
0
0
27283
Technical draftspersons, engineering designers and model makers (with specialisation, not elsewhere classified)-complex tasks
0
0
0
1
27284
Technical draftspersons, engineering designers and model makers (with specialisation, not elsewhere classified)-highly complex tasks
0
0
0
1
27293
Supervisors in technical drawing, engineering design and model making
0
0
0
0
27294
Managers in technical drawing, engineering design and model making
0
0
0
1
27302
Technical occupations in production planning and scheduling-skilled tasks
0
-1
0
0
27303
Technical occupations in production planning and scheduling-complex tasks
0
0
0
1
27304
Technical occupations in production planning and scheduling-highly complex tasks
0
0
0
1
27312
Technical occupations in quality control-skilled tasks
0
0
0
0
27313
Technical occupations in quality control-complex tasks
0
0
0
1
27314
Technical occupations in quality control-highly complex tasks
0
0
1
1
27393
Supervisors in production planning and scheduling
0
0
0
0
27394
Managers in production planning and scheduling
0
0
0
1
28101
Occupations in textile making (without specialisation)-unskilled/semiskilled tasks
0
-1
0
0
28102
Occupations in textile making (without specialisation)-skilled tasks
0
-1
0
0
28103
Occupations in textile making (without specialisation)-complex tasks
0
0
0
0
28104
Occupations in textile making (without specialisation)-highly complex tasks
0
0
0
0
28112
Occupations in textile design-skilled tasks
0
0
0
0
28113
Occupations in textile design-complex tasks
0
0
0
0
28114
Occupations in textile design-highly complex tasks
0
0
0
1
28122
Occupations in textile production-skilled tasks
0
-1
0
0
28123
Occupations in textile production-complex tasks
0
0
0
0
28132
Occupations in spinning and rope-making-skilled tasks
0
-1
0
0
28133
Occupations in spinning and rope-making-complex tasks
0
0
0
0
28142
Occupations in textile finishing-skilled tasks
0
-1
0
0
28143
Occupations in textile finishing-complex tasks
0
0
0
0
28193
Supervisors in textile making
0
-1
0
0
28194
Managers in textile making
0
-1
0
0
28212
Occupations in fashion design-skilled tasks
0
0
0
0
28213
Occupations in fashion design-complex tasks
0
0
0
0
28214
Occupations in fashion design-highly complex tasks
0
0
0
1
28221
Occupations in the production of clothing, hat and cap making-unskilled/semiskilled tasks
0
-1
0
0
28222
Occupations in the production of clothing, hat and cap making-skilled tasks
0
-1
0
0
28223
Occupations in the production of clothing, hat and cap making-complex tasks
0
0
0
0
28224
Occupations in the production of clothing, hat and cap making-highly complex tasks
0
0
0
0
28232
Occupations in manufacturing of heavy duty textile products, sail makers-skilled tasks
0
-1
0
0
28242
Occupations in upholstery and interior fitting of vehicles-skilled tasks
0
-1
0
0
28293
Supervisors in the production of clothing and other textile products
0
0
0
0
28294
Managers in the production of clothing and other textile products
0
0
0
0
28301
Occupations in leather- and fur-making and -processing (without specialisation)-unskilled/semiskilled tasks
0
-1
0
0
28312
Occupations in leather making-skilled tasks
0
-1
0
0
28313
Occupations in leather making-complex tasks
0
-1
0
0
28314
Occupations in leather making-highly complex tasks
0
0
0
0
28322
Occupations in saddlery and production of leather wares
0
-1
0
0
28332
Occupations in shoemaking-skilled tasks
0
-1
0
0
28333
Occupations in shoemaking-complex tasks
0
0
0
0
28342
Occupations in fur treatment and processing-skilled tasks
0
-1
0
0
28343
Occupations in fur treatment and processing-complex tasks
0
-1
0
0
28393
Supervisors in leather- and fur-making and -processing
0
0
0
0
28394
Managers in leather- and fur-making and -processing
0
0
0
0
29102
Occupations in beverage production (without specialisation)-skilled tasks
0
-1
0
0
29103
Occupations in beverage production (without specialisation)-complex tasks
0
-1
0
0
29104
Occupations in beverage production (without specialisation)-highly complex tasks
0
0
0
0
29112
Brewers and maltsters-skilled tasks
0
-1
0
0
29113
Brewers and maltsters-complex tasks
0
-1
0
0
29114
Brewers and maltsters-highly complex tasks
0
0
0
0
29122
Coopers-skilled tasks
0
-1
0
0
29123
Coopers-complex tasks
0
-1
0
0
29132
Distillers-skilled tasks
0
-1
0
0
29133
Distillers-complex tasks
0
-1
0
0
29134
Distillers-highly complex tasks
0
-1
0
0
29142
Occupations in fruit juice production-skilled tasks
0
-1
0
0
29143
Occupations in fruit juice production-complex tasks
0
-1
0
0
29152
Tasters of foodstuffs and beverages-skilled tasks
0
-1
0
0
29193
Supervisors in beverages production
0
-1
0
0
29194
Managers in beverages production
0
-1
0
0
29201
Occupations in the production of foodstuffs (without specialisation)-unskilled/semiskilled tasks
0
-1
0
0
29202
Occupations in the production of foodstuffs (without specialisation)-skilled tasks
0
-1
0
0
29203
Occupations in the production of foodstuffs (without specialisation)-complex tasks
0
0
0
0
29204
Occupations in the production of foodstuffs (without specialisation)-highly complex tasks
0
0
0
0
29212
Occupations in the production of milling products and animal feeds-skilled tasks
0
-1
0
0
29213
Occupations in the production of milling products and animal feeds-complex tasks
0
0
0
0
29222
Occupations in the production of baked goods and pastries-skilled tasks
0
-1
0
0
29223
Occupations in the production of baked goods and pastries-complex tasks
0
0
0
0
29232
Occupations in meat processing-skilled tasks
0
-1
0
0
29233
Occupations in meat processing-complex tasks
0
0
0
0
29242
Occupations in fish processing-skilled tasks
0
-1
0
0
29243
Occupations in fish processing-complex tasks
0
0
0
0
29252
Occupations in the production of dairy goods-skilled tasks
0
-1
0
0
29253
Occupations in the production of dairy goods-complex tasks
0
-1
0
0
29262
Occupations in confectionery production-skilled tasks
0
-1
0
0
29263
Occupations in confectionery production-complex tasks
0
-1
0
0
29272
Occupations in the manufacturing of tobacco products-skilled tasks
0
-1
0
0
29273
Occupations in the manufacturing of tobacco products-complex tasks
0
0
0
0
29282
Occupations in the production of foodstuffs (with specialisation, not elsewhere classified)-skilled tasks
0
-1
0
0
29283
Occupations in the production of foodstuffs (with specialisation, not elsewhere classified)-complex tasks
0
0
0
0
29284
Occupations in the production of foodstuffs (with specialisation, not elsewhere classified)-highly complex tasks
0
0
0
0
29293
Supervisors in the production of foodstuffs, confectionery and tobacco products
0
0
0
0
29294
Managers in the production of foodstuffs, confectionery and tobacco products
0
0
0
0
29301
Cooks (without specialisation)-unskilled/semiskilled tasks
0
-1
0
0
29302
Cooks (without specialisation)-skilled tasks
0
-1
0
0
29312
Hors d'œuvrier, pantry or pastry cooks-skilled tasks
0
-1
0
0
29322
Roast, grill or fish cooks-skilled tasks
0
-1
0
0
29382
Cooks (with specialisation, not elsewhere classified)-skilled tasks
0
-1
0
0
29393
Supervisors in cooking
0
-1
0
0
29394
Managers in cooking
0
-1
0
0
31102
Occupations in construction scheduling and supervision (without specialisation)-skilled tasks
0
-1
0
0
31103
Occupations in construction scheduling and supervision (without specialisation)-complex tasks
0
0
0
0
31104
Occupations in construction scheduling and supervision (without specialisation)-highly complex tasks
0
0
0
1
31114
Occupations in architecture-highly complex tasks
0
0
0
0
31124
Occupations in urban and spatial planning-highly complex tasks
0
0
0
1
31132
Occupations in the planning of traffic routes and other infrastructure-skilled tasks
0
0
0
0
31133
Occupations in the planning of traffic routes and other infrastructure-complex tasks
0
0
0
0
31134
Occupations in the planning of traffic routes and other infrastructure-highly complex tasks
0
0
0
0
31142
Occupations in water resource management-skilled tasks
0
-1
0
0
31143
Occupations in water resource management-complex tasks
0
0
0
0
31144
Occupations in water resource management-highly complex tasks
0
-1
0
0
31152
Occupations in the maintenance and renovation of buildings-skilled tasks
0
-1
0
0
31153
Occupations in the maintenance and renovation of buildings-complex tasks
0
-1
0
0
31154
Occupations in the maintenance and renovation of buildings-highly complex tasks
0
0
0
1
31163
Construction surveyors and inspectors-complex tasks
0
-1
0
0
31164
Construction surveyors and inspectors-highly complex tasks
0
0
0
0
31173
Occupations in construction accounting and cost calculation for buildings-complex tasks
0
1
1
1
31174
Occupations in construction accounting and cost calculation for buildings-highly complex tasks
0
0
0
1
31193
Supervisors in construction scheduling and supervision, and architecture
0
-1
0
0
31194
Managers in construction scheduling and supervision, and architecture
0
0
0
0
31212
Occupations in surveying-skilled tasks
0
0
0
0
31213
Occupations in surveying-complex tasks
0
0
0
0
31214
Occupations in surveying-highly complex tasks
0
0
0
0
31222
Occupations in cartography-skilled tasks
0
0
0
1
31223
Occupations in cartography-complex tasks
0
0
0
1
31224
Occupations in cartography-highly complex tasks
0
0
0
0
32101
Occupations in building construction (without specialisation)-unskilled/semiskilled tasks
0
-1
0
0
32102
Occupations in building construction (without specialisation)-skilled tasks
0
-1
0
0
32103
Occupations in building construction (without specialisation)-complex tasks
0
0
0
0
32104
Occupations in building construction (without specialisation)-highly complex tasks
0
0
0
0
32112
Occupations in the construction of concrete and reinforced concrete structures-skilled tasks
0
-1
0
0
32113
Occupations in the construction of concrete and reinforced concrete structures-complex tasks
0
0
0
0
32122
Occupations in the bricklayer's trade-skilled tasks
0
-1
0
0
32123
Occupations in the bricklayer's trade-complex tasks
0
-1
0
0
32132
Occupations in chimney construction-skilled tasks
0
-1
0
0
32142
Occupations in roofing-skilled tasks
0
-1
0
0
32152
Occupations in facade construction-skilled tasks
0
-1
0
0
32162
Occupations in scaffolding-skilled tasks
0
-1
0
0
32172
Occupations in building demolition-skilled tasks
0
-1
0
0
32193
Supervisors in building construction
0
-1
0
0
32201
Occupations in civil engineering (without specialisation)-unskilled/semiskilled tasks
0
-1
0
0
32202
Occupations in civil engineering (without specialisation)-skilled tasks
0
-1
0
0
32203
Occupations in civil engineering (without specialisation)-complex tasks
0
0
0
0
32204
Occupations in civil engineering (without specialisation)-highly complex tasks
0
0
0
0
32212
Pavers and stone setters-skilled tasks
0
-1
0
0
32222
Occupations in road and asphalt construction-skilled tasks
0
-1
0
0
32223
Occupations in road and asphalt construction-complex tasks
0
0
0
0
32224
Occupations in road and asphalt construction-highly complex tasks
0
0
0
0
32232
Occupations in railroad construction-skilled tasks
0
-1
0
0
32233
Occupations in railroad construction-complex tasks
0
0
0
0
32242
Occupations in well construction-skilled tasks
0
-1
0
0
32243
Occupations in well construction-complex tasks
0
0
0
0
32252
Occupations in canal and tunnel construction-skilled tasks
0
-1
0
0
32253
Occupations in canal and tunnel construction-complex tasks
0
0
0
0
32262
Occupations in land improvement and hydraulic construction-skilled tasks
0
-1
0
0
32263
Occupations in land improvement and hydraulic construction-complex tasks
0
0
0
1
32264
Occupations in land improvement and hydraulic construction-highly complex tasks
0
0
0
0
32293
Supervisors in civil engineering
0
-1
0
0
33101
Floor layers (without specialisation)-unskilled/semiskilled tasks
0
-1
0
0
33102
Floor layers (without specialisation)-skilled tasks
0
-1
0
0
33112
Pavers, tile setters and mosaic-layers-skilled tasks
0
-1
0
0
33122
Composition floor and terrazzo-layers-skilled tasks
0
-1
0
0
33132
Parquet floor layers-skilled tasks
0
-1
0
0
33133
Parquet floor layers-complex tasks
0
-1
0
0
33193
Supervisors in floor laying
0
0
0
0
33211
Painters and varnishers-unskilled/semiskilled tasks
0
-1
0
0
33212
Painters and varnishers-skilled tasks
0
-1
0
0
33213
Painters and varnishers-complex tasks
0
-1
0
0
33222
Plasterers-skilled tasks
0
-1
0
0
33223
Plasterers-complex tasks
0
-1
0
0
33232
Occupations in the waterproofing of buildings -skilled tasks
0
-1
0
0
33233
Occupations in the waterproofing of buildings -complex tasks
0
-1
0
0
33242
Occupations in the preservation of structures and wooden building components-skilled tasks
0
-1
0
0
33243
Occupations in the preservation of structures and wooden building components-complex tasks
0
-1
0
0
33293
Supervisors in the painting, varnishing, plastering, water proofing of buildings, preservation of structures and wooden building components
0
-1
0
0
33301
Occupations in the interior construction and dry walling (without specialisation)-unskilled/semiskilled tasks
0
-1
0
0
33302
Occupations in the interior construction and dry walling (without specialisation)-skilled tasks
0
-1
0
0
33303
Occupations in the interior construction and dry walling (without specialisation)-complex tasks
0
0
0
0
33312
Occupations in insulation-skilled tasks
0
-1
0
0
33322
Carpenters-skilled tasks
0
-1
0
0
33323
Carpenters-complex tasks
0
-1
0
0
33332
Joiners-skilled tasks
0
-1
0
0
33342
Glaziers-skilled tasks
0
-1
0
0
33352
Roller shutter and jalousie installers-skilled tasks
0
-1
0
0
33393
Supervisors in interior construction and dry walling, insulation, carpentry, glazing, roller shutter and jalousie installation
0
-1
0
0
34102
Occupations in building services engineering (without specialisation)-skilled tasks
0
0
0
0
34103
Occupations in building services engineering (without specialisation)-complex tasks
0
0
0
0
34104
Occupations in building services engineering (without specialisation)-highly complex tasks
0
0
0
1
34112
Green keepers and equipment managers-skilled tasks
0
-1
0
0
34193
Supervisors in building services engineering
0
0
0
1
34201
Occupations in plumping (without specialisation)-unskilled/semiskilled tasks
0
-1
0
0
34202
Occupations in plumping (without specialisation)-skilled tasks
0
-1
0
0
34203
Occupations in plumping (without specialisation)-complex tasks
0
0
0
0
34212
Occupations in sanitation, heating, ventilating, and air conditioning-skilled tasks
0
-1
0
0
34213
Occupations in sanitation, heating, ventilating, and air conditioning-complex tasks
0
0
0
0
34214
Occupations in sanitation, heating, ventilating, and air conditioning-highly complex tasks
0
0
0
1
34222
Occupations in the construction of stoves, storage heaters, and forced-air heating systems-skilled tasks
0
-1
0
0
34232
Occupations in ventilating, and air conditioning-skilled tasks
0
-1
0
0
34233
Occupations in ventilating, and air conditioning-complex tasks
0
0
0
0
34234
Occupations in ventilating, and air conditioning-highly complex tasks
0
0
0
1
34293
Supervisors in sanitation, heating, ventilating, and air conditioning
0
0
0
0
34301
Occupations in building services and waste disposal (without specialisation)-unskilled/semiskilled tasks
0
-1
0
0
34302
Occupations in building services and waste disposal (without specialisation)-skilled tasks
0
-1
0
0
34303
Occupations in building services and waste disposal (without specialisation)-complex tasks
0
0
0
0
34304
Occupations in building services and waste disposal (without specialisation)-highly complex tasks
0
0
0
1
34312
Technical occupations in water supply and wastewater disposal-skilled tasks
0
-1
0
0
34313
Technical occupations in water supply and wastewater disposal-complex tasks
0
0
0
0
34314
Technical occupations in water supply and wastewater disposal -highly complex tasks
0
0
0
1
34322
Occupations in pipeline construction-skilled tasks
0
-1
0
0
34323
Occupations in pipeline construction-complex tasks
0
0
0
0
34324
Occupations in pipeline construction
0
0
0
1
34332
Occupations in waste management-skilled tasks
0
-1
0
0
34333
Occupations in waste management-complex tasks
0
0
0
0
34334
Occupations in waste management-highly complex tasks
0
0
0
0
34342
Occupations in plant, vessels, tank and apparatus construction-skilled tasks
0
-1
0
0
34343
Occupations in plant, vessels, tank and apparatus construction-complex tasks
0
0
0
0
34344
Occupations in plant, vessels, tank and apparatus construction-highly complex tasks
0
0
0
0
34393
Supervisors in building services and waste disposal
0
0
0
0
41103
Occupations in mathematics-complex tasks
0
1
0
1
41104
Occupations in mathematics-highly complex tasks
0
1
0
1
41114
Occupations in statistics-highly complex tasks
0
0
0
1
41184
Occupations in mathematics (with specialisation, not elsewhere classified)-highly complex tasks
0
1
0
1
41194
Managers in mathematics and statistics
0
-1
0
0
41203
Occupations in biology (without specialisation)-complex tasks
0
0
0
0
41204
Occupations in biology (without specialisation)-highly complex tasks
0
0
0
0
41212
Biological technical laboratory occupations-skilled tasks
0
-1
0
0
41213
Biological technical laboratory occupations-complex tasks
0
0
0
0
41214
Biological technical laboratory occupations-highly complex tasks
0
0
0
0
41222
Occupations in the preparation of biological specimen-skilled tasks
0
-1
0
0
41234
Occupations in ecology-highly complex tasks
0
0
0
0
41244
Occupations in botany-highly complex tasks
0
0
0
0
41254
Occupations in zoology-highly complex tasks
0
0
0
0
41264
Occupations in microbiology-highly complex tasks
0
0
0
0
41274
Occupations in human biology-highly complex tasks
0
0
0
0
41283
Occupations in biology (with specialisation, not elsewhere classified)-complex tasks
0
0
0
0
41284
Occupations in biology (with specialisation, not elsewhere classified)-highly complex tasks
0
0
0
0
41293
Supervisors in biology
0
-1
0
0
41294
Managers in biology
0
-1
0
0
41303
Occupations in chemistry (without specialisation)-complex tasks
0
0
0
0
41304
Occupations in chemistry (without specialisation)-highly complex tasks
0
0
0
0
41311
Occupations in chemical and pharmaceutical engineering-unskilled/semiskilled tasks
0
-1
0
0
41312
Occupations in chemical and pharmaceutical engineering-skilled tasks
0
-1
0
0
41313
Occupations in chemical and pharmaceutical engineering-complex tasks
0
0
0
0
41314
Occupations in chemical and pharmaceutical engineering-highly complex tasks
0
0
0
0
41322
Chemical technical laboratory occupations-skilled tasks
0
-1
0
0
41323
Chemical technical laboratory occupations-complex tasks
0
0
0
0
41324
Chemical technical laboratory occupations-highly complex tasks
0
0
0
0
41333
Operators of chemical production plants-complex tasks
0
0
0
0
41343
Operators of oil and gas refinery plants-complex tasks
0
0
0
0
41383
Occupations in chemistry (with specialisation, not elsewhere classified)-complex tasks
0
0
0
0
41384
Occupations in chemistry (with specialisation, not elsewhere classified)-highly complex tasks
0
0
0
0
41393
Supervisors in chemistry
0
-1
0
0
41394
Managers in chemistry
0
-1
0
0
41403
Occupations in physics (without specialisation)-complex tasks
0
0
0
1
41404
Occupations in physics (without specialisation)-highly complex tasks
0
0
0
1
41412
Physical technical laboratory occupations-skilled tasks
0
-1
0
0
41413
Physical technical laboratory occupations-complex tasks
0
-1
0
0
41414
Physical technical laboratory occupations-highly complex tasks
0
0
0
0
41422
Occupations in material engineering-skilled tasks
0
-1
0
0
41423
Occupations in material engineering-complex tasks
0
-1
0
0
41424
Occupations in material engineering-highly complex tasks
0
0
0
0
41432
Occupations in construction materials testing-skilled tasks
0
-1
0
0
41433
Occupations in construction materials testing-complex tasks
0
-1
0
0
41434
Occupations in construction materials testing-highly complex tasks
0
0
0
0
41482
Occupations in physics (with specialisation, not elsewhere classified)-skilled tasks
0
-1
0
0
41483
Occupations in physics (with specialisation, not elsewhere classified)-complex tasks
0
-1
0
0
41484
Occupations in physics (with specialisation, not elsewhere classified)-highly complex tasks
0
0
0
1
41493
Supervisors in physics
0
-1
0
0
41494
Managers in physics
0
-1
0
0
42112
Occupations in geotechnical engineering-skilled tasks
0
0
0
0
42113
Occupations in geotechnical engineering-complex tasks
0
0
0
0
42114
Occupations in geotechnical engineering-highly complex tasks
0
0
0
0
42124
Occupations in geology-highly complex tasks
0
0
0
0
42134
Occupations in geography-highly complex tasks
0
0
0
1
42142
Occupations in meteorology-skilled tasks
0
0
0
0
42143
Occupations in meteorology-complex tasks
0
0
0
1
42144
Occupations in meteorology-highly complex tasks
0
0
0
1
42202
Occupations in environmental protection engineering (without specialisation)-skilled tasks
0
-1
0
0
42203
Occupations in environmental protection engineering (without specialisation)-complex tasks
0
0
0
0
42204
Occupations in environmental protection engineering (without specialisation)-highly complex tasks
0
0
0
0
42212
Chimney sweeps-skilled tasks
0
-1
0
0
42283
Occupations in environmental protection engineering (with specialisation, not elsewhere classified)-highly complex tasks
0
0
0
0
42293
Supervisors in environmental protection engineering
0
-1
0
0
42312
Occupations in environmental protection administration and environmental protection consulting-skilled tasks
0
0
1
1
42313
Occupations in environmental protection administration and environmental protection consulting-complex tasks
0
0
0
1
42314
Occupations in environmental protection administration and environmental protection consulting-highly complex tasks
0
0
0
1
42323
Water pollution and emission control, waste management commissioners-complex tasks
0
0
0
0
42324
Water pollution and emission control, waste management commissioners-highly complex tasks
0
0
0
1
42333
Radiation protection commissioners-complex tasks
0
0
0
0
42334
Radiation protection commissioners-highly complex tasks
0
0
0
0
42394
Managers in environmental protection administration and consulting
0
-1
0
0
43102
Occupations in computer science (without specialisation)-skilled tasks
0
0
0
1
43103
Occupations in computer science (without specialisation)-complex tasks
0
0
0
1
43104
Occupations in computer science (without specialisation)-highly complex tasks
0
0
0
1
43112
Occupations in business informatics-skilled tasks
0
0
0
1
43113
Occupations in business informatics-complex tasks
0
0
1
1
43114
Occupations in business informatics-highly complex tasks
0
0
0
1
43122
Occupations in computer engineering-skilled tasks
0
0
0
1
43123
Occupations in computer engineering-complex tasks
0
0
0
1
43124
Occupations in computer engineering-highly complex tasks
0
0
0
0
43134
Occupations in bio- and medical informatics-highly complex tasks
0
0
0
1
43144
Occupations in geoinformatics-highly complex tasks
0
0
0
1
43152
Occupations in media informatics-skilled tasks
0
0
0
1
43153
Occupations in media informatics-complex tasks
0
0
1
1
43154
Occupations in media informatics-highly complex tasks
0
1
0
1
43194
Managers in computer science
0
0
0
1
43214
Occupations in IT-system-analysis-highly complex tasks
0
1
1
1
43223
Occupations in IT-application-consulting-complex tasks
0
0
0
1
43224
Occupations in IT-application-consulting-highly complex tasks
0
0
1
1
43233
Occupations in IT-sales-complex tasks
0
0
0
1
43294
Managers in IT-system-analysis, IT-application-consulting and IT-sales
0
0
0
1
43313
Occupations in IT-network engineering-complex tasks
0
0
0
1
43314
Occupations in IT-network engineering-highly complex tasks
0
1
1
1
43323
Occupations in IT-coordination-complex tasks
0
0
1
1
43333
Occupations in IT-organisation-complex tasks
0
1
1
1
43343
Occupations in IT-system-administration-complex tasks
0
0
1
1
43353
Occupations in database development and administration-complex tasks
0
1
1
1
43363
Occupations in web administration-complex tasks
0
1
1
1
43383
Occupations in IT-network engineering, IT-coordination, IT-administration and IT-organisation (with specialisation, not elsewhere classified)-complex tasks
0
0
0
1
43384
Occupations in IT-network engineering, IT-coordination, IT-administration and IT-organisation (with specialisation, not elsewhere classified)-highly complex tasks
0
0
0
1
43394
Managers in IT-network engineering, IT-coordination, IT-administration and IT-organisation (with specialisation, not elsewhere classified)
0
0
0
1
43412
Occupations in software development-skilled tasks
0
0
0
1
43413
Occupations in software development-complex tasks
0
0
1
1
43414
Occupations in software development-highly complex tasks
0
0
1
1
43423
Occupations in programming-complex tasks
0
1
1
1
43494
Managers in software development and programming
0
0
0
1
51112
Technical occupations in railway operation-skilled tasks
0
0
0
0
51113
Technical occupations in railway operation-complex tasks
0
-1
0
0
51122
Technical occupations in aircraft operation-skilled tasks
0
-1
0
0
51123
Technical occupations in aircraft operation-complex tasks
0
-1
0
0
51132
Technical occupations in ship operation-skilled tasks
0
-1
0
0
51133
Technical occupations in ship operation-complex tasks
0
-1
0
0
51134
Technical occupations in ship operation-highly complex tasks
0
-1
0
0
51182
Technical occupations in railway, aircraft and ship operation (with specialisation, not elsewhere classified)-skilled tasks
0
0
0
0
51183
Technical occupations in railway, aircraft and ship operation (with specialisation, not elsewhere classified)-complex tasks
0
0
0
0
51193
Supervisors in railway, aircraft and ship operation
0
0
0
0
51212
Road and tunnel inspection and controlling commissioners-skilled tasks
0
-1
0
0
51222
Occupations in the inspection and maintenance of railway infrastructure-skilled tasks
0
0
0
0
51223
Occupations in the inspection and maintenance of railway infrastructure-complex tasks
0
0
0
0
51224
Occupations in the inspection and maintenance of railway infrastructure-highly complex tasks
0
0
0
0
51233
Technical occupations in air traffic control-complex tasks
0
0
0
1
51234
Technical occupations in air traffic control-highly complex tasks
0
0
0
1
51242
Waterway and bridges inspection and controlling commissioners-skilled tasks
0
-1
0
0
51243
Waterway and bridges inspection and controlling commissioners-complex tasks
0
0
0
0
51293
Supervisors in the inspection and maintenance of traffic infrastructure
0
-1
0
0
51311
Occupations in warehousing and logistics-unskilled/semiskilled tasks
0
-1
0
0
51312
Occupations in warehousing and logistics-skilled tasks
0
0
0
0
51321
Occupations in postal and other delivery services-unskilled/semiskilled tasks
0
-1
0
0
51322
Occupations in postal and other delivery services-skilled tasks
0
-1
0
0
51332
Occupations in cargo handling-skilled tasks
0
-1
0
0
51393
Supervisors in warehousing and logistics, in postal and other delivery services, and in cargo handling
0
-1
0
0
51394
Managers in warehousing and logistics, in postal and other delivery services, and in cargo handling
0
0
0
0
51412
Service occupations in road and railway traffic-skilled tasks
0
0
0
0
51422
Service occupations in air traffic-skilled tasks
0
0
0
0
51432
Service occupations in shipping traffic-skilled tasks
0
-1
0
0
51493
Supervisors of service personnel in passenger traffic
0
0
0
0
51503
Occupations in traffic surveillance and control (without specialisation)-complex tasks
0
0
0
0
51504
Occupations in traffic surveillance and control (without specialisation)-highly complex tasks
0
0
0
1
51512
Occupations in the surveillance and control of road traffic-skilled tasks
0
1
1
1
51513
Occupations in the surveillance and control of road traffic-complex tasks
0
0
0
0
51522
Occupations in the surveillance and control of railway traffic-skilled tasks
0
0
0
1
51523
Occupations in the surveillance and control of railway traffic-complex tasks
0
0
0
0
51532
Occupations in the surveillance and control of air traffic-skilled tasks
0
0
0
1
51533
Occupations in the surveillance and control of air traffic-complex tasks
0
0
0
0
51534
Occupations in the surveillance and control of air traffic-highly complex tasks
0
0
0
1
51543
Occupations in the surveillance and control of shipping traffic-complex tasks
0
0
0
0
51583
Occupations in traffic surveillance and control (with specialisation, not elsewhere classified)-complex tasks
0
0
0
0
51593
Supervisors in traffic surveillance and control
0
0
0
0
51594
Managers in traffic surveillance and control
0
0
0
1
51613
Management assistants in transport-complex tasks
0
0
0
1
51614
Management assistants in transport -highly complex tasks
0
0
0
1
51622
Forwarding agents and management assistants in logistics-skilled tasks
0
0
0
0
51623
Forwarding agents and management assistants in logistics-complex tasks
0
0
0
1
51624
Forwarding agents and management assistants in logistics-highly complex tasks
0
0
0
1
51632
Management assistants in road and railway transport-skilled tasks
0
0
0
1
51633
Management assistants in road and railway transport-complex tasks
0
0
0
1
51642
Management assistants in air transport-skilled tasks
0
0
0
1
51643
Management assistants in air transport-complex tasks
0
0
0
1
51652
Management assistants in shipping transport-skilled tasks
0
0
0
0
51653
Management assistants in shipping transport-complex tasks
0
0
0
1
51662
Management assistants in courier services, express and postal delivery services-skilled tasks
0
0
0
0
51663
Management assistants in courier services, express and postal delivery services-complex tasks
0
0
0
1
51694
Managers in transport and logistics
0
0
0
1
52112
Professional drivers (passengers transport)-skilled tasks
0
0
0
0
52122
Professional drivers (cargo trucks)-skilled tasks
0
-1
0
0
52132
Bus and tram drivers-skilled tasks
0
0
0
0
52182
Drivers of vehicles in road traffic (with specialisation, not elsewhere classified)-skilled tasks
0
0
0
0
52202
Drivers of train engines and other railway vehicles-skilled tasks
0
0
0
0
52313
Pilots of planes and airliners-complex tasks
0
0
0
0
52314
Pilots of planes and airliners-highly complex tasks
0
0
0
0
52383
Aircraft pilots (with specialisation, not elsewhere classified)-complex tasks
0
0
0
0
52384
Aircraft pilots (with specialisation, not elsewhere classified)-highly complex tasks
0
0
0
1
52413
Deck officers/mates and ship’s captains or skippers-complex tasks
0
-1
0
0
52414
Deck officers/mates and ship’s captains or skippers-highly complex tasks
0
0
0
0
52422
Ship’s masters in inland navigation and port traffic-skilled tasks
0
-1
0
0
52423
Ship’s masters in inland navigation and port traffic-complex tasks
0
0
0
0
52512
Drivers of agricultural and forestry machines-skilled tasks
0
-1
0
0
52522
Drivers of earthmoving and related machines-skilled tasks
0
-1
0
0
52531
Operators of cranes, lifts and related lifting devices-unskilled/semiskilled tasks
0
-1
0
0
52532
Operators of cranes, lifts and related lifting devices-skilled tasks
0
-1
0
0
52593
Supervisors of drivers and operators of construction and transportation vehicles and equipment
0
-1
0
0
53111
Occupations in physical security, protection of valuables, and personal protection-unskilled/semiskilled tasks
0
0
0
0
53112
Occupations in physical security, protection of valuables, and personal protection-skilled tasks
0
0
0
0
53122
Occupations focusing on workplace safety and safety technology-skilled tasks
0
0
0
0
53123
Occupations focusing on workplace safety and safety technology-complex tasks
0
0
0
1
53124
Occupations focusing on workplace safety and safety technology-highly complex tasks
0
0
0
1
53132
Occupations in fire protection-skilled tasks
0
0
0
0
53133
Occupations in fire protection-complex tasks
0
0
0
0
53134
Occupations in fire protection-highly complex tasks
0
0
0
1
53142
Pool attendants and lifeguards-skilled tasks
0
0
0
0
53152
Private detectives-skilled tasks
0
0
0
1
53162
Debt collectors-skilled tasks
0
0
0
1
53182
Occupations in physical security, personal protection, fire protection and workplace safety (with specialisation, not elsewhere classified)-skilled tasks
0
0
0
0
53183
Occupations in physical security, personal protection, fire protection and workplace safety (with specialisation, not elsewhere classified)-complex tasks
0
0
0
0
53184
Occupations in physical security, personal protection, fire protection and workplace safety (with specialisation, not elsewhere classified)-highly complex tasks
0
0
0
1
53193
Supervisors in physical security, personal protection, fire protection and workplace safety
0
0
0
0
53194
Managers in physical security, personal protection, fire protection and workplace safety
0
0
0
0
53212
Uniformed police personnel-skilled tasks
0
0
0
0
53213
Uniformed police personnel-complex tasks
0
0
0
0
53214
Uniformed police personnel-highly complex tasks
0
0
0
1
53222
Detectives and police officers in criminal investigation departments-skilled tasks
0
0
0
0
53223
Detectives and police officers in criminal investigation departments-complex tasks
0
0
0
0
53224
Detectives and police officers in criminal investigation departments-highly complex tasks
0
0
0
1
53232
Court officers-skilled tasks
0
0
0
1
53233
Court officers-complex tasks
0
0
0
0
53241
Police officers in penal institutions- unskilled/semiskilled tasks
0
0
0
0
53242
Police officers in penal institutions-skilled tasks
0
0
0
0
53243
Police officers in penal institutions-complex tasks
0
0
0
1
53244
Police officers in penal institutions-highly complex tasks
0
0
0
1
53312
Occupations in occupational health and safety administration-skilled tasks
0
0
0
0
53313
Occupations in occupational health and safety administration-complex tasks
0
0
0
1
53314
Occupations in occupational health and safety administration-highly complex tasks
0
0
0
1
53322
Occupations in public health authority and hygiene control-skilled tasks
0
0
0
0
53323
Occupations in public health authority and hygiene control-complex tasks
0
-1
0
0
53332
Occupations in food control-skilled tasks
0
0
0
0
53333
Occupations in food control-complex tasks
0
0
0
0
53342
Occupations in disinfection and pest control-skilled tasks
0
-1
0
0
53393
Supervisors in occupational health and safety administration, public health authority, and disinfection
0
0
0
0
53394
Managers in occupational health and safety administration, public health authority, and disinfection
0
0
0
0
54101
Occupations in cleaning services (without specialisation)-unskilled/semiskilled tasks
0
0
0
0
54112
Occupations in building cleaning services-skilled tasks
0
-1
0
0
54113
Occupations in building cleaning services-complex tasks
0
-1
0
0
54122
Occupations in glass and window cleaning services-skilled tasks
0
-1
0
0
54132
Occupations in textile cleaning services-skilled tasks
0
-1
0
0
54142
Occupations in machine and equipment cleaning services-skilled tasks
0
-1
0
0
54152
Occupations in vehicle cleaning services-skilled tasks
0
-1
0
0
54182
Occupations in cleaning services (with specialisation, not elsewhere classified)-skilled tasks
0
-1
0
0
54193
Supervisors in cleaning services
0
0
0
0
61112
Occupations in purchasing-skilled tasks
0
0
1
1
61113
Occupations in purchasing-complex tasks
0
0
1
1
61122
Occupations in sales (except information and communication technologies)-skilled tasks
0
0
1
1
61123
Occupations in sales (except information and communication technologies)-complex tasks
0
0
1
1
61124
Occupations in sales (except information and communication technologies)-highly complex tasks
0
0
0
1
61132
Trade brokers and auctioneers-skilled tasks
0
0
0
1
61133
Trade brokers and auctioneers-complex tasks
0
1
1
1
61142
Occupations in placing and servicing vending machines-skilled tasks
0
-1
0
0
61152
Money lenders and pawn brokers-skilled tasks
0
0
1
1
61162
Occupations in rental services (except money lending and pawn broking)-skilled tasks
0
0
1
1
61194
Managers in purchasing and sales
0
0
0
1
61203
Management assistants in trade (without specialisation)-complex tasks
0
0
0
1
61204
Management assistants in trade (without specialisation)-highly complex tasks
0
0
0
1
61212
Management assistants in wholesale and foreign trade-skilled tasks
0
0
0
1
61213
Management assistants in wholesale and foreign trade-complex tasks
0
0
0
1
61214
Management assistants in wholesale and foreign trade-highly complex tasks
0
0
0
1
61282
Management assistants in trade (with specialisation, not elsewhere classified)-skilled tasks
0
0
0
1
61283
Management assistants in trade (with specialisation, not elsewhere classified)-complex tasks
0
0
0
1
61284
Management assistants in trade (with specialisation, not elsewhere classified)-highly complex tasks
0
0
0
1
61294
Managers in trade
0
0
0
1
61312
Occupations in real estate marketing and administration-skilled tasks
0
0
0
1
61313
Occupations in real estate marketing and administration-complex tasks
0
0
1
1
61314
Occupations in real estate marketing and administration-highly complex tasks
0
0
0
1
61323
Occupations in facility management-complex tasks
0
0
1
1
61394
Managers in real estate and facility management
0
0
0
1
62101
Sales occupations in retail trade (without product specialisation)-unskilled/semiskilled tasks
0
-1
0
0
62102
Sales occupations in retail trade (without product specialisation)-skilled tasks
0
0
0
0
62103
Sales occupations in retail trade (without product specialisation)-complex tasks
0
0
0
1
62112
Cashiers and ticket agents-skilled tasks
0
0
0
0
62122
Stall and market sellers-skilled tasks
0
-1
0
0
62182
Sales occupations in retail trade (without product specialisation; with specialisation, not elsewhere classified)-skilled tasks
0
-1
0
0
62183
Sales occupations in retail trade (without product specialisation; with specialisation, not elsewhere classified)-complex tasks
0
0
0
0
62193
Supervisors in retail trade
0
0
1
1
62194
Managers in retail trade
0
0
0
1
62212
Sales occupations (retail trade) selling clothing, sporting goods, leather goods and shoes-skilled tasks
0
0
0
0
62222
Sales occupations (retail trade) selling jewellery and watches-skilled tasks
0
0
0
1
62232
Sales occupations (retail trade) selling office supplies, gifts and toys-skilled tasks
0
0
0
0
62242
Sales occupations (retail trade) selling electrical and electronic goods, and household supplies-skilled tasks
0
0
0
0
62252
Sales occupations (retail trade) selling furniture and furnishings-skilled tasks
0
0
0
1
62262
Sales occupations (retail trade) in gardening stores, home improvement stores, pet shops and zoo supplies stores-skilled tasks
0
0
0
0
62272
Sales occupations (retail trade) selling motor vehicles, bicycles, motorbikes, and related supplies-skilled tasks
0
0
0
0
62282
Sales occupations in retail trade (with specialisation, not elsewhere classified)-skilled tasks
0
-1
0
0
62301
Sales occupations (retail) selling foodstuffs (without specialisation)-unskilled/semiskilled tasks
0
-1
0
0
62302
Sales occupations (retail) selling foodstuffs (without specialisation)-skilled tasks
0
0
0
0
62312
Sales occupations (retail) selling baked goods, pastries and confectionaries-skilled tasks
0
-1
0
0
62322
Sales occupations (retail) selling meat products-skilled tasks
0
-1
0
0
62382
Sales occupations (retail) selling foodstuffs (with specialisation, not elsewhere classified)-skilled tasks
0
0
0
1
62412
Sales occupations (retail) selling drugstore products and pharmaceuticals-skilled tasks
0
0
0
0
62422
Sales occupations (retail) selling medical supplies and healthcare goods-skilled tasks
0
0
0
0
62512
Sales occupations (retail) selling books-skilled tasks
0
0
0
0
62513
Sales occupations (retail) selling books-complex tasks
0
0
0
1
62514
Sales occupations (retail) selling books-highly complex tasks
0
0
0
1
62522
Sales occupations (retail) selling art and antiques-skilled tasks
0
0
0
0
62532
Sales occupations (retail) selling musical instruments, recordings or sheet music-skilled tasks
0
0
0
0
63112
Management assistants in tourism-skilled tasks
0
0
0
1
63113
Management assistants in tourism-complex tasks
0
0
1
1
63114
Management assistants in tourism-highly complex tasks
0
0
0
1
63122
Management assistants in the sports and fitness industry, sports administrators-skilled tasks
0
0
0
1
63123
Management assistants in the sports and fitness industry, sports administrators-complex tasks
0
1
1
1
63124
Management assistants in the sports and fitness industry, sports administrators-highly complex tasks
0
0
0
1
63132
Animators and guest attendants-skilled tasks
0
0
0
0
63142
Tourist guides and tour guides-skilled tasks
0
-1
0
0
63143
Tourist guides and tour guides-complex tasks
0
-1
0
0
63194
Managers in tourism and the sports (and fitness) industry
0
0
0
1
63212
Management assistants in hotels-skilled tasks
0
0
0
1
63213
Management assistants in hotels-complex tasks
0
0
0
1
63221
Occupations in hotel service-unskilled/semiskilled tasks
0
-1
0
0
63222
Occupations in hotel service-skilled tasks
0
0
0
1
63293
Supervisors in hotels
0
0
0
0
63294
Managers in hotels
0
0
0
1
63301
Gastronomy occupations (without specialisation)-unskilled/semiskilled tasks
0
-1
0
0
63302
Gastronomy occupations (without specialisation)-skilled tasks
0
-1
0
0
63303
Gastronomy occupations (without specialisation)-complex tasks
0
0
0
0
63312
Occupations in system catering-skilled tasks
0
-1
0
0
63313
Occupations in system catering-complex tasks
0
0
0
1
63322
Barkeepers-skilled tasks
0
-1
0
0
63382
Gastronomy occupations (with specialisation, not elsewhere classified)-skilled tasks
0
0
0
0
63383
Gastronomy occupations (with specialisation, not elsewhere classified)-complex tasks
0
-1
0
0
63393
Supervisors in gastronomy and system catering
0
0
0
0
63394
Managers in gastronomy and system catering
0
0
0
0
63401
Occupations in event organisation and management-unskilled/semiskilled tasks
0
0
0
0
63402
Occupations in event organisation and management-skilled tasks
0
0
0
1
63403
Occupations in event organisation and management-complex tasks
0
0
0
1
63404
Occupations in event organisation and management-highly complex tasks
0
0
0
1
71104
Managing directors and executive board members-highly complex tasks
0
0
0
1
71214
Legislators-highly complex tasks
0
0
0
1
71224
Senior officials of special interest organisations-highly complex tasks
0
0
0
1
71234
Elected employee representatives in firms-highly complex tasks
0
1
1
1
71302
Occupations in business administration and technical business management (without specialisation)-skilled tasks
0
0
1
1
71303
Occupations in business administration and technical business management (without specialisation)-complex tasks
0
0
1
1
71304
Occupations in business administration and technical business management (without specialisation)-highly complex tasks
0
0
0
1
71314
Occupations in business organisation and planning-highly complex tasks
0
1
1
1
71324
Occupations in business consulting-highly complex tasks
0
0
0
1
71333
Occupations in business development-highly complex tasks
0
0
1
1
71382
Occupations in business organisation and strategy (with specialisation, not elsewhere classified)-skilled tasks
0
-1
0
0
71383
Occupations in business organisation and strategy (with specialisation, not elsewhere classified)-complex tasks
0
0
0
1
71384
Occupations in business organisation and strategy (with specialisation, not elsewhere classified)-highly complex tasks
0
0
0
1
71393
Supervisors in business organisation and strategy
0
0
1
1
71394
Managers in business organisation and strategy
0
0
0
1
71401
Office clerks and secretaries (without specialisation)-unskilled/semiskilled tasks
0
0
0
1
71402
Office clerks and secretaries (without specialisation)-skilled tasks
0
0
1
1
71403
Office clerks and secretaries (without specialisation)-complex tasks
0
0
1
1
71412
Foreign language secretaries and foreign language correspondence clerks-skilled tasks
0
0
0
1
71413
Foreign language secretaries and foreign language correspondence clerks-complex tasks
0
0
0
1
71423
Interpreters and translators-complex tasks
0
0
0
1
71424
Interpreters and translators-highly complex tasks
0
0
0
1
71432
Shorthand and audio typists-skilled tasks
0
1
1
1
71433
Shorthand and audio typists-complex tasks
0
0
0
1
71442
Coders, proof readers and related clerks-skilled tasks
0
1
1
1
71452
Customer or passenger information office clerks-skilled tasks
0
0
1
1
71493
Supervisors of office clerks and secretaries
0
0
0
1
71512
Occupations in human resources development and personnel service-skilled tasks
0
0
0
1
71513
Occupations in human resources development and personnel service-complex tasks
0
0
1
1
71514
Occupations in human resources development and personnel service-highly complex tasks
0
0
0
1
71522
Occupations in recruiting and employment services-skilled tasks
0
0
1
1
71523
Occupations in recruiting and employment services-complex tasks
0
0
1
1
71524
Occupations in recruiting and employment services-highly complex tasks
0
0
0
1
71594
Managers in human resources management and personnel services
0
0
0
1
72112
Bankers-skilled tasks
0
0
0
1
72113
Bankers-complex tasks
0
0
0
1
72122
Investment consultants and other occupations in financial services-skilled tasks
0
0
0
1
72123
Investment consultants and other occupations in financial services-complex tasks
0
0
0
1
72124
Investment consultants and other occupations in financial services-highly complex tasks
0
0
0
1
72132
Insurance salespersons-skilled tasks
0
0
1
1
72133
Insurance salespersons-complex tasks
0
0
0
1
72134
Insurance salespersons-highly complex tasks
0
0
0
1
72144
Financial analysts-highly complex tasks
0
0
0
1
72182
Occupations in insurance and financial services (with specialisation, not elsewhere classified)-skilled tasks
0
0
0
1
72183
Occupations in insurance and financial services (with specialisation, not elsewhere classified)-complex tasks
0
0
0
1
72184
Occupations in insurance and financial services (with specialisation, not elsewhere classified)-complex tasks
0
0
0
1
72194
Managers in insurance and financial services
0
0
0
1
72212
Occupations in accounting-skilled tasks
0
0
1
1
72213
Occupations in accounting-complex tasks
0
1
1
1
72214
Occupations in accounting-highly complex tasks
0
1
1
1
72223
Occupations in cost accounting and calculation-complex tasks
0
1
1
1
72224
Occupations in cost accounting and calculation-highly complex tasks
0
1
1
1
72233
Occupations in controlling-complex tasks
0
1
1
1
72234
Occupations in controlling-highly complex tasks
0
1
1
1
72243
Occupations in auditing-complex tasks
0
1
1
1
72244
Occupations in auditing-highly complex tasks
0
0
0
1
72294
Managers in accounting, controlling and auditing
0
0
0
1
72302
Occupations in tax consultancy-skilled tasks
0
0
0
1
72303
Occupations in tax consultancy-complex tasks
0
0
0
1
72304
Occupations in tax consultancy-highly complex tasks
0
0
0
1
73104
Occupations in legal services, jurisdiction, and other officers of the court (without specialisation)-highly complex tasks
0
0
0
1
73112
Assistants in lawyers’ and notaries’ offices-skilled tasks
0
0
0
1
73113
Assistants in lawyers’ and notaries’ offices-complex tasks
0
0
1
1
73124
Notaries-highly complex tasks
0
0
0
1
73134
Lawyers-highly complex tasks
0
0
0
1
73144
Prosecutors-highly complex tasks
0
0
0
1
73154
Judges-highly complex tasks
0
0
0
1
73162
Occupations in the national security service-skilled tasks
0
0
0
1
73163
Occupations in the national security service-complex tasks
0
0
0
1
73164
Occupations in the national security service-highly complex tasks
0
0
0
1
73183
Occupations in legal services, jurisdiction, and other officers of the court (with specialisation, not elsewhere classified)-complex tasks
0
0
0
1
73184
Occupations in legal services, jurisdiction, and other officers of the court (with specialisation, not elsewhere classified)-highly complex tasks
0
0
0
1
73194
Managers in legal services, jurisdiction, and of other officers of the court
0
0
0
1
73201
Occupations in public administration (without specialisation)-unskilled/semiskilled tasks
0
0
0
1
73202
Occupations in public administration (without specialisation)-skilled tasks
0
0
0
1
73203
Occupations in public administration (without specialisation)-complex tasks
0
0
0
1
73204
Occupations in public administration (without specialisation)-highly complex tasks
0
0
0
1
73212
Occupations in the social service administration and the social security system-skilled tasks
0
0
0
1
73213
Occupations in the social service administration and the social security system-complex tasks
0
0
0
1
73214
Occupations in the social service administration and the social security system-highly complex tasks
0
0
1
1
73222
Administrative occupations in the welfare and health care system-skilled tasks
0
0
0
0
73223
Administrative occupations in the welfare and health care system-complex tasks
0
0
0
1
73224
Administrative occupations in the welfare and health care system-highly complex tasks
0
0
0
1
73231
Occupations in tax administration-unskilled/semiskilled tasks
0
0
0
1
73232
Occupations in tax administration-skilled tasks
0
0
0
1
73233
Occupations in tax administration-complex tasks
0
0
0
1
73234
Occupations in tax administration-highly complex tasks
0
0
0
1
73241
Occupations in the customs service-unskilled/semiskilled tasks
0
0
0
1
73242
Occupations in the customs service-skilled tasks
0
0
0
0
73243
Occupations in the customs service-complex tasks
0
0
0
0
73244
Occupations in the customs service-highly complex tasks
0
0
0
1
73252
Occupations in the administration of justice-skilled tasks
0
0
0
1
73253
Occupations in the administration of justice-complex tasks
0
0
0
1
73254
Occupations in the administration of justice-highly complex tasks
0
0
0
1
73282
Occupations in public administration (with specialisation, not elsewhere classified)-skilled tasks
0
0
0
1
73283
Occupations in public administration (with specialisation, not elsewhere classified)-complex tasks
0
0
0
1
73284
Occupations in public administration (with specialisation, not elsewhere classified)-highly complex tasks
0
0
0
1
73293
Supervisors in public administration
0
0
0
1
73294
Managers in public administration
0
0
0
1
73312
Occupations in archiving-skilled tasks
0
0
1
1
73313
Occupations in archiving-complex tasks
0
0
0
1
73314
Occupations in archiving-highly complex tasks
0
0
0
1
73322
Library occupations-skilled tasks
0
0
1
1
73323
Library occupations-complex tasks
0
0
0
1
73324
Library occupations-highly complex tasks
0
0
0
1
73332
Occupations in documentation and information services-skilled tasks
0
0
1
1
73333
Occupations in documentation and information services-complex tasks
0
1
1
1
73334
Occupations in documentation and information services-highly complex tasks
0
1
1
1
73342
Occupations in medical documentation-skilled tasks
0
0
0
1
73394
Managers in media, documentation and information services
0
0
0
1
81102
Medical assistants (without specialisation)-skilled tasks
0
-1
0
0
81103
Medical assistants (without specialisation)-complex tasks
0
-1
0
0
81112
Dental assistants-skilled tasks
0
-1
0
0
81113
Dental assistants-complex tasks
0
-1
0
0
81132
Orthoptists-skilled tasks
0
0
0
0
81142
Veterinary assistants-skilled tasks
0
-1
0
0
81143
Veterinary assistants-complex tasks
0
0
0
0
81182
Medical assistants (with specialisation, not elsewhere classified)-skilled tasks
0
-1
0
0
81183
Medical assistants (with specialisation, not elsewhere classified)-complex tasks
0
0
0
0
81212
Technical laboratory occupations in medicine-skilled tasks
0
-1
0
0
81213
Technical laboratory occupations in medicine-complex tasks
0
-1
0
0
81214
Technical laboratory occupations in medicine-highly complex tasks
0
-1
0
0
81222
Technical occupations in medical laboratories for functional diagnostics-skilled tasks
0
-1
0
0
81223
Technical occupations in medical laboratories for functional diagnostics-complex tasks
0
0
0
0
81224
Technical occupations in medical laboratories for functional diagnostics-highly complex tasks
0
-1
0
0
81232
Technical occupations in radiology-skilled tasks
0
-1
0
0
81233
Technical occupations in radiology-complex tasks
0
-1
0
0
81234
Technical occupations in radiology-highly complex tasks
0
-1
0
0
81242
Technical occupations in veterinary medicine-skilled tasks
0
-1
0
0
81243
Technical occupations in veterinary medicine-complex tasks
0
0
0
0
81294
Managers in medical laboratories
0
0
0
0
81301
Occupations in nursing (without specialisation)-unskilled/semiskilled tasks
0
-1
0
0
81302
Occupations in nursing (without specialisation)-skilled tasks
0
-1
0
0
81313
Occupations in nursing specialised in a particular branch of nursing-complex tasks
0
-1
0
0
81323
Occupations in nursing specialised in paediatrics-complex tasks
0
-1
0
0
81332
Surgical and medico-technical assistants-skilled tasks
0
-1
0
0
81333
Surgical and medico-technical assistants-complex tasks
0
-1
0
0
81341
Occupations in emergency medical services-unskilled/semiskilled tasks
0
-1
0
0
81342
Occupations in emergency medical services-skilled tasks
0
-1
0
0
81343
Occupations in emergency medical services-complex tasks
0
-1
0
0
81352
Occupations in obstetrics and maternity care-skilled tasks
0
-1
0
0
81353
Occupations in obstetrics and maternity care-complex tasks
0
-1
0
0
81382
Occupations in nursing (with specialisation, not elsewhere classified)-skilled tasks
0
-1
0
0
81383
Occupations nursing (with specialisation, not elsewhere classified)-complex tasks
0
-1
0
0
81393
Supervisors in nursing, emergency medical services and obstetrics
0
0
0
0
81394
Managers in nursing, emergency medical services and obstetrics
0
0
0
0
81404
Medical doctors (without specialisation)-highly complex tasks
0
0
0
0
81414
Medical doctors specialised in pediatrics and adolescent medicine-highly complex tasks
0
-1
0
0
81424
Medical doctors specialised in internal medicine-highly complex tasks
0
0
0
0
81434
Medical doctors specialised in surgery-highly complex tasks
0
0
0
0
81444
Medical doctors specialised in dermatology, otorhinolaryngology, ophthalmology, gynaecology, andrology and related medical fields-highly complex tasks
0
0
0
0
81454
Medical doctors specialised in anaesthesiology-highly complex tasks
0
0
0
0
81464
Medical doctors specialised in neurology, psychiatry, psychotherapy and psychosomatic medicine-highly complex tasks
0
0
0
0
81474
Dentists and orthodontists-highly complex tasks
0
-1
0
0
81484
Medical doctors (with specialisation, not elsewhere classified)-highly complex tasks
0
0
0
0
81494
Managers in human medicine and dentistry
0
0
0
0
81504
Veterinaries (without specialisation)-highly complex tasks
0
-1
0
0
81514
Veterinaries for large and farm animals-highly complex tasks
0
-1
0
0
81524
Veterinaries for pets-highly complex tasks
0
-1
0
0
81532
Non-medical animal health practitioners-skilled tasks
0
-1
0
0
81584
Occupations in veterinary medicine and non-medical animal health practitioners (with specialisation, not elsewhere classified)-highly complex tasks
0
-1
0
0
81594
Managers in veterinary medicine and non-medical animal health practitioners
0
0
0
0
81614
Occupations in non-clinical psychology-highly complex tasks
0
0
0
1
81623
Occupations in clinical psychology-complex tasks
0
0
0
1
81624
Occupations in clinical psychology-highly complex tasks
0
0
0
1
81634
Occupations in non-medical psychotherapy-highly complex tasks
0
0
0
0
81712
Occupations in physiotherapy-skilled tasks
0
-1
0
0
81713
Occupations in physiotherapy-complex tasks
0
-1
0
0
81714
Occupations in physiotherapy-highly complex tasks
0
0
0
0
81722
Occupations in occupational therapy-skilled tasks
0
0
0
0
81723
Occupations in occupational therapy-complex tasks
0
-1
0
0
81724
Occupations in occupational therapy-highly complex tasks
0
0
0
0
81733
Occupations in speech therapy-complex tasks
0
-1
0
0
81734
Occupations in speech therapy-highly complex tasks
0
0
0
1
81743
Occupations in music and art therapy-complex tasks
0
0
0
0
81752
Practitioners of alternative medicine and homeopathy-skilled tasks
0
-1
0
0
81753
Practitioners of alternative medicine and homeopathy-complex tasks
0
-1
0
0
81762
Dieticians and Nutritionists-skilled tasks
0
0
0
0
81763
Dieticians and Nutritionists-complex tasks
0
0
0
0
81764
Dieticians and Nutritionists-highly complex tasks
0
-1
0
0
81772
Podologists-skilled tasks
0
0
0
0
81782
Occupations in non-medical therapy and alternative medicine (with specialisation, not elsewhere classified)-skilled tasks
0
0
0
0
81783
Occupations in non-medical therapy and alternative medicine (with specialisation, not elsewhere classified)-complex tasks
0
0
0
0
81784
Occupations in non-medical therapy and of alternative medicine (specific occupation, not elsewhere classified)-highly complex tasks
0
-1
0
0
81794
Managers in in non-medical therapy and alternative medicine
0
0
0
0
81804
Pharmacists-highly complex tasks
0
0
0
0
81814
Medical doctors specialised in pharmacology-highly complex tasks
0
0
0
0
81822
Pharmaceutical-technical assistants-skilled tasks
0
-1
0
0
81883
Occupations in pharmacy (with specialisation, not elsewhere classified)-complex tasks
0
0
0
1
81884
Occupations in pharmacy (with specialisation, not elsewhere classified)-highly complex tasks
0
0
0
1
81894
Managers in pharmacy
0
0
0
0
82101
Occupations in geriatric care (without specialisation)-unskilled/semiskilled tasks
0
-1
0
0
82102
Occupations in geriatric care (without specialisation)-skilled tasks
0
-1
0
0
82103
Occupations in geriatric care (without specialisation)-complex tasks
0
-1
0
0
82182
Occupations in geriatric care (with specialisation, not elsewhere classified)-skilled tasks
0
-1
0
0
82183
Occupations in geriatric care (with specialisation, not elsewhere classified)-complex tasks
0
-1
0
0
82194
Managers in geriatric care
0
0
0
1
82212
Occupations providing health counselling-skilled tasks
0
0
0
0
82213
Occupations providing health counselling-complex tasks
0
0
0
0
82214
Occupations providing health counselling-highly complex tasks
0
0
0
1
82222
Occupations in wellness-skilled tasks
0
0
0
1
82223
Occupations in wellness-complex tasks
0
0
0
1
82232
Occupations providing nutritional advice-skilled tasks
0
0
0
0
82233
Occupations providing nutritional advice-complex tasks
0
0
0
1
82243
Quality assurance representative in the health care system-highly complex tasks
0
0
0
1
82283
Occupations providing nutritional advice or health counselling, and occupations in wellness (with specialisation, not elsewhere classified)-complex tasks
0
0
0
0
82284
Occupations providing nutritional advice or health counselling, and occupations in wellness (with specialisation, not elsewhere classified)-highly complex tasks
0
0
0
1
82311
Occupations in hairdressing-unskilled/semiskilled tasks
0
-1
0
0
82312
Occupations in hairdressing-skilled tasks
0
-1
0
0
82322
Occupations in cosmetics-skilled tasks
0
-1
0
0
82332
Tattooists and piercers-skilled tasks
0
-1
0
0
82342
Make-up artists-skilled tasks
0
-1
0
0
82343
Make-up artists-complex tasks
0
0
0
0
82393
Supervisors in body care
0
-1
0
0
82402
Occupations in funeral services-skilled tasks
0
0
0
0
82403
Occupations in funeral services-complex tasks
0
0
0
0
82493
Supervisors in funeral services
0
0
0
0
82494
Managers in funeral services
0
0
0
0
82502
Technical occupations in medicine (without specialisation)-skilled tasks
0
0
0
0
82503
Technical occupations in medicine (without specialisation)-complex tasks
0
0
0
0
82504
Technical occupations in medicine (without specialisation)-highly complex tasks
0
0
0
0
82512
Technical occupations in orthopaedic and rehabilitation-skilled tasks
0
-1
0
0
82513
Technical occupations in orthopaedic and rehabilitation-complex tasks
0
0
0
0
82514
Technical occupations in orthopaedic and rehabilitation-highly complex tasks
0
0
0
0
82522
Occupations in ophthalmic optics-skilled tasks
0
-1
0
0
82523
Occupations in ophthalmic optics-complex tasks
0
0
0
0
82524
Occupations in ophthalmic optics-highly complex tasks
0
0
0
0
82532
Occupations in hearing-aid acoustics-skilled tasks
0
-1
0
0
82533
Occupations in hearing-aid acoustics-complex tasks
0
0
0
0
82534
Occupations in hearing-aid acoustics-highly complex tasks
0
0
0
0
82542
Technical occupations in prosthetic dentistry-skilled tasks
0
-1
0
0
82593
Supervisors in medicine, orthopaedic and rehabilitation technology
0
0
0
0
82594
Managers in medicine, orthopaedic and rehabilitation technology
0
0
0
0
83111
Occupations in child care and child-rearing-unskilled/semiskilled tasks
0
-1
0
0
83112
Occupations in child care and child-rearing-skilled tasks
0
0
0
0
83123
Occupations in social work and social pedagogics-complex tasks
0
0
0
1
83124
Occupations in social work and social pedagogics-highly complex tasks
0
0
0
0
83131
Pedagogic specialists in social care work and special needs education-unskilled/semiskilled tasks
0
-1
0
0
83132
Pedagogic specialists in social care work and special needs education-skilled tasks
0
-1
0
0
83133
Pedagogic specialists in social care work and special needs education-complex tasks
0
0
0
0
83134
Pedagogic specialists in social care work and special needs education-highly complex tasks
0
0
0
0
83142
Social care workers specialized in household assistance and family care-skilled tasks
0
-1
0
0
83143
Social care workers specialized in household assistance and family care-complex tasks
0
-1
0
0
83154
Occupations in social, educational and addiction counselling-highly complex tasks
0
0
0
1
83193
Supervisors in education and social work, and of pedagogic specialists in social care work
0
0
0
1
83194
Managers in education and social work, and of pedagogic specialists in social care work
0
0
0
1
83211
Occupations in housekeeping-unskilled/semiskilled tasks
0
-1
0
0
83212
Occupations in housekeeping-skilled tasks
0
-1
0
0
83213
Occupations in housekeeping-complex tasks
0
0
0
0
83223
Occupations in consumer counselling-highly complex tasks
0
0
0
1
83293
Supervisors in housekeeping and consumer counselling
0
0
0
1
83314
Occupations in theology-highly complex tasks
0
0
0
1
83322
Occupations in church community work-skilled tasks
0
-1
0
0
83323
Occupations in church community work-complex tasks
0
0
0
0
83332
Members of religious orders-skilled tasks
0
-1
0
0
83333
Members of religious orders-complex tasks
0
0
0
0
83382
Occupations in theology and church community work (with specialisation, not elsewhere classified)-skilled tasks
0
0
0
0
83383
Occupations in theology and church community work (with specialisation, not elsewhere classified)-complex tasks
0
0
0
0
83384
Occupations in theology and church community work (with specialisation, not elsewhere classified)-highly complex tasks
0
0
0
0
83394
Managers in theology and church community work
0
0
0
1
84114
Teachers in primary education-highly complex tasks
0
1
0
1
84124
Teachers in secondary education-highly complex tasks
0
0
0
1
84134
Teachers in schools for special needs education-highly complex tasks
0
0
0
1
84144
Occupations in teacher training-highly complex tasks
0
0
0
1
84183
Teachers in schools of general education (with specialisation, not elsewhere classified)-complex tasks
0
0
0
1
84184
Teachers in schools of general education (with specialisation, not elsewhere classified)-highly complex tasks
0
0
0
1
84194
Managers in schools of general education
0
0
0
1
84213
Teachers for occupation-specific subjects at vocational schools-complex tasks
0
0
0
1
84214
Teachers for occupation-specific subjects at vocational schools-highly complex tasks
0
0
0
1
84223
In-company instructors in vocational training-complex tasks
0
0
0
1
84224
In-company instructors in vocational training-highly complex tasks
0
0
0
1
84294
Managers in vocational schools and in-company training of apprentices
0
0
0
1
84304
Teachers and researcher at universities and colleges-highly complex tasks
0
0
0
1
84394
Managers at universities and colleges
0
1
0
1
84404
Teachers in adult education (without specialisation)-highly complex tasks
0
0
0
1
84412
Occupations in music education-skilled tasks
0
0
0
0
84413
Occupations in music education-complex tasks
0
0
0
1
84414
Occupations in music education-highly complex tasks
0
0
0
1
84424
Occupations in religious education-highly complex tasks
0
0
0
1
84434
Occupations in art and theatre education-highly complex tasks
0
0
0
1
84444
Occupations in IT-application training-highly complex tasks
0
0
0
1
84454
(Foreign) Language teachers-highly complex tasks
0
1
1
1
84483
Teachers at educational institutions other than schools (with specialisation, not elsewhere classified except driving, flying and sports instructors)-complex tasks
0
0
0
1
84484
Teachers at educational institutions other than schools (with specialisation, not elsewhere classified except driving, flying and sports instructors)-highly complex tasks
0
0
0
1
84494
Managers at educational institutions other than schools
0
0
0
1
84503
Sports instructors (without specialisation)-complex tasks
0
0
0
0
84504
Sports instructors (without specialisation)-highly complex tasks
0
0
0
0
84513
Driving instructors-complex tasks
0
0
0
0
84523
Flying instructors-complex tasks
0
0
0
0
84533
Dance instructors-complex tasks
0
0
0
0
84543
Coaches in ball sports-complex tasks
0
0
0
0
84553
Trainer in fitness and gymnastics-complex tasks
0
0
0
0
84583
Sports instructors (with specialisation, not elsewhere classified)-complex tasks
0
0
0
0
91104
Occupations in philology (without specialisation)-highly complex tasks
0
1
0
1
91114
Occupations in German philology-highly complex tasks
0
1
1
1
91124
Occupations in English and American philology-highly complex tasks
0
0
0
1
91134
Occupations in Romance philology-highly complex tasks
0
0
0
1
91144
Occupations in Slavic philology-highly complex tasks
0
0
0
1
91154
Occupations in Arabic and Oriental philology-highly complex tasks
0
0
0
1
91164
Occupations in Asian philology-highly complex tasks
0
0
0
1
91174
Occupations in Classics-highly complex tasks
0
1
1
1
91184
Occupations in philology (with specialisation, not elsewhere classified)-highly complex tasks
0
1
1
1
91214
Occupations in philosophy, religion and ethics-highly complex tasks
0
1
1
1
91224
Occupations in history-highly complex tasks
0
1
0
1
91233
Occupations in archaeology-complex tasks
0
0
0
0
91234
Occupations in archaeology-highly complex tasks
0
0
0
1
91244
Occupations in media science and theatre studies-highly complex tasks
0
1
0
1
91254
Occupations in regional science-highly complex tasks
0
0
0
1
91264
Occupations in anthropology and ethnology-highly complex tasks
0
0
0
1
91314
Occupations in political science-highly complex tasks
0
1
1
1
91324
Occupations in sociology-highly complex tasks
0
1
0
1
91334
Occupations in pedagogy-highly complex tasks
0
0
0
1
91341
Occupations in market and opinion research-unskilled/semiskilled tasks
0
0
0
1
91342
Occupations in market and opinion research-skilled tasks
0
0
0
1
91343
Occupations in market and opinion research-complex tasks
0
0
0
1
91344
Occupations in market and opinion research-highly complex tasks
0
1
1
1
91354
Occupations in demography-highly complex tasks
0
1
1
1
91384
Occupations in the social sciences (with specialisation, not elsewhere classified)-highly complex tasks
0
0
0
1
91404
Occupations in economics (without specialisation)-highly complex tasks
0
0
0
1
91484
Occupations in economics (with specialisation, not elsewhere classified)-highly complex tasks
0
1
1
1
92112
Occupations in advertising and marketing-skilled tasks
0
0
0
1
92113
Occupations in advertising and marketing-complex tasks
0
0
1
1
92114
Occupations in advertising and marketing-highly complex tasks
0
0
0
1
92122
Occupations in dialog marketing-skilled tasks
0
0
0
1
92123
Occupations in dialog marketing-complex tasks
0
0
0
1
92133
Occupations in customer management-highly complex tasks
0
0
0
1
92194
Managers in advertising and marketing
0
0
0
1
92203
Occupations in public relations-complex tasks
0
0
1
1
92204
Occupations in public relations-highly complex tasks
0
1
1
1
92294
Managers in public relations
0
0
0
1
92302
Occupations in publishing and media management (without specialisation)-skilled tasks
0
0
1
1
92303
Occupations in publishing and media management (without specialisation)-complex tasks
0
0
1
1
92304
Occupations in publishing and media management (without specialisation)-highly complex tasks
0
0
0
1
92382
Occupations in publishing and media management (other specifc fields)-skilled tasks
0
0
1
1
92383
Occupations in publishing and media management (other specifc fields)-complex tasks
0
0
0
1
92384
Occupations in publishing and media management (other specifc fields)-highly complex tasks
0
1
1
1
92394
Managers in publishing and media management
0
0
0
1
92412
Editors and journalists-skilled tasks
0
1
1
1
92413
Editors and journalists-complex tasks
0
0
1
1
92414
Editors and journalists-highly complex tasks
0
0
0
0
92424
Copy editors-highly complex tasks
0
1
1
1
92434
Authors and writers-highly complex tasks
0
0
1
1
92494
Managers in editorial work and journalism
0
0
0
1
93102
Occupations in product and industrial design-skilled tasks
0
0
0
1
93103
Occupations in product and industrial design-complex tasks
0
0
0
0
93104
Occupations in product and industrial design-highly complex tasks
0
0
0
1
93212
Occupations in interior design-skilled tasks
0
0
1
1
93213
Occupations in interior design-complex tasks
0
0
0
0
93214
Occupations in interior design-highly complex tasks
0
0
0
0
93222
Occupations in visual marketing-skilled tasks
0
0
0
0
93223
Occupations in visual marketing-complex tasks
0
0
0
1
93232
Occupations in interior decoration-skilled tasks
0
-1
0
0
93233
Occupations in interior decoration-complex tasks
0
0
0
0
93293
Supervisors in interior design, visual marketing, and interior decoration
0
0
0
0
93302
Occupations in artisan craftwork and fine arts (without specialisation)-skilled tasks
0
-1
0
0
93303
Occupations in artisan craftwork and fine arts (without specialisation)-complex tasks
0
-1
0
0
93304
Occupations in artisan craftwork and fine arts (without specialisation)-highly complex tasks
0
0
0
0
93312
Occupations in sculpting-skilled tasks
0
-1
0
0
93313
Occupations in sculpting-complex tasks
0
-1
0
0
93323
Painters and illustrators-highly complex tasks
0
0
0
0
93332
Occupations in turnery and toy manufacture-skilled tasks
0
-1
0
0
93333
Occupations in turnery and toy manufacture-complex tasks
0
0
0
0
93342
Gilders-skilled tasks
0
-1
0
0
93343
Gilders-complex tasks
0
-1
0
0
93352
Chandlers-skilled tasks
0
-1
0
0
93382
Occupations in artisan craftwork and fine arts (with specialisation, not elsewhere classified)-skilled tasks
0
-1
0
0
93383
Occupations in artisan craftwork and fine arts (with specialisation, not elsewhere classified)-complex tasks
0
-1
0
0
93393
Supervisors in artisan craftwork and fine arts
0
0
0
0
93412
Artisans designing ceramics-skilled tasks
0
-1
0
0
93413
Artisans designing ceramics-complex tasks
0
0
0
0
93422
Artisans painting glassware, ceramics and porcelain-skilled tasks
0
-1
0
0
93432
Artisans working in glass blowing-skilled tasks
0
-1
0
0
93433
Artisans working in glass blowing-complex tasks
0
0
0
0
93493
Supervisors in artisan craftwork using ceramics and glassware
0
0
0
0
93512
Artisans working with metal-skilled tasks
0
-1
0
0
93513
Artisans working with metal-complex tasks
0
-1
0
0
93522
Artisans producing jewellery or working with precious stones and metals-skilled tasks
0
-1
0
0
93523
Artisans producing jewellery or working with precious stones and metals-complex tasks
0
0
0
0
93524
Artisans producing jewellery or working with precious stones and metals-highly complex tasks
0
-1
0
0
93532
Engravers-skilled tasks
0
-1
0
0
93542
Producers of advertising signs and illuminated advertisements-skilled tasks
0
-1
0
0
93593
Supervisors of artisans working with metal
0
0
0
0
93602
Occupations in musical instrument making (without specialisation)-skilled tasks
0
-1
0
0
93603
Occupations in musical instrument making (without specialisation)-complex tasks
0
-1
0
0
93604
Occupations in musical instrument making (without specialisation)-highly complex tasks
0
0
0
0
93612
Occupations making bowed and plucked string instruments-skilled tasks
0
-1
0
0
93613
Occupations making bowed and plucked string instruments-complex tasks
0
-1
0
0
93622
Occupations making woodwind instruments-skilled tasks
0
-1
0
0
93623
Occupations making woodwind instruments-complex tasks
0
0
0
0
93632
Occupations making brass instruments-skilled tasks
0
-1
0
0
93633
Occupations making brass instruments-complex tasks
0
0
0
0
93642
Occupations making pianos and harpsichords-skilled tasks
0
-1
0
0
93643
Occupations making pianos and harpsichords-complex tasks
0
-1
0
0
93652
Occupations making organs and harmoniums-skilled tasks
0
-1
0
0
93653
Occupations making organs and harmoniums-complex tasks
0
0
0
0
93682
Occupations in musical instrument making (with specialisation, not elsewhere classified)-skilled tasks
0
-1
0
0
93683
Occupations in musical instrument making (with specialisation, not elsewhere classified)-complex tasks
0
-1
0
0
93693
Supervisors in musical instrument making
0
0
0
0
94114
Musicians-highly complex tasks
0
-1
0
0
94124
Singers-highly complex tasks
0
-1
0
0
94134
Conductors-highly complex tasks
0
-1
0
0
94144
Composers-highly complex tasks
0
0
1
0
94183
Musicians, singers and conductors (with specialisation, not elsewhere classified)-complex tasks
0
0
0
1
94184
Musicians, singers and conductors (with specialisation, not elsewhere classified)-highly complex tasks
0
0
0
0
94214
Actors-highly complex tasks
0
-1
0
0
94224
Dancers and choreographers-highly complex tasks
0
-1
0
0
94232
Models-skilled tasks
0
-1
0
0
94243
Athletes and professional sportspersons-complex tasks
0
0
0
0
94252
Occupations in personal escort services-skilled tasks
0
-1
0
0
94283
Occupations in acting, dancing, athletics and related occupations (with specialisation, not elsewhere classified)-complex tasks
0
-1
0
0
94303
Presenters and entertainers (without specialisation)-complex tasks
0
-1
0
0
94313
Comedians and cabaret artists-complex tasks
0
-1
0
0
94323
Magicians and illusionists-complex tasks
0
-1
0
0
94334
Radio and television presenters-highly complex tasks
0
0
0
0
94342
Occupations in gambling and betting-skilled tasks
0
0
0
0
94383
Occupations in presentation and entertainment (with specialisation, not elsewhere classified)-complex tasks
0
0
0
0
94402
Occupations in theatre, film and television productions (without specialisation)-skilled tasks
0
0
1
1
94403
Occupations in theatre, film and television productions (without specialisation)-complex tasks
0
0
0
1
94404
Occupations in theatre, film and television productions (without specialisation)-highly complex tasks
0
0
0
1
94413
Occupations in managing theatre, film and television productions-complex tasks
0
0
0
0
94414
Occupations managing theatre, film and television productions-highly complex tasks
0
0
0
0
94482
Occupations in theatre, film and television productions (with specialisation, not elsewhere classified)-skilled tasks
0
0
0
0
94483
Occupations in theatre, film and television productions (with specialisation, not elsewhere classified)-complex tasks
0
0
1
1
94484
Occupations in theatre, film and television productions (with specialisation, not elsewhere classified)-highly complex tasks
0
0
0
1
94493
Supervisors in theatre, film and television productions
0
0
0
1
94494
Managers in theatre, film and television productions
0
0
0
1
94512
Technical occupation in event technology and stagecraft-skilled tasks
0
-1
0
0
94513
Technical occupation in event technology and stagecraft-complex tasks
0
0
0
0
94514
Technical occupation in event technology and stagecraft-highly complex tasks
0
0
0
0
94522
Cinematographers, camera assistants, and projectionists-skilled tasks
0
-1
0
0
94523
Cinematographers, camera assistants, and projectionists-complex tasks
0
-1
0
0
94532
Technical occupations in video and sound production-skilled tasks
0
0
0
0
94533
Technical occupations in video and sound production-complex tasks
0
0
0
0
94534
Technical occupations in video and sound production-highly complex tasks
0
0
0
0
94582
Occupations in event technology, cinematography, and sound engineering (with specialisation, not elsewhere classified)-skilled tasks
0
-1
0
0
94593
Supervisors in event technology, cinematography, and sound engineering
0
0
0
0
94612
Stage and costume designers-skilled tasks
0
0
0
0
94613
Stage and costume designers-complex tasks
0
0
0
0
94614
Stage and costume designers-highly complex tasks
0
0
0
0
94622
Prop designers-skilled tasks
0
0
0
0
94623
Prop designers-complex tasks
0
0
0
0
94693
Supervisors in stage, costume and prop design
0
0
0
0
94704
Occupations in museums (without specialisation)-highly complex tasks
0
0
0
1
94712
Technical occupations in museums and exhibitions-skilled tasks
0
-1
0
0
94713
Technical occupations in museums and exhibitions-complex tasks
0
0
0
0
94714
Technical occupations in museums and exhibitions-highly complex tasks
0
0
0
0
94724
Art experts-highly complex tasks
0
0
0
1
94794
Managers in museum
0
0
0
1
The IAB Occupational Panel provides a comprehensive database for analysing the characteristics and development of occupations in Germany. The current version of the panel covers the years 2012 to 2022 and is an update of the 2012-2018 Occupational Panel (see documentation). The changes to the first version of the Occupational Panel are listed below. The occupational panel is based on the IAB Employment History (BeH), which contains information on all employees subject to social security contributions and marginal part-time employees. The employment characteristics contained therein are aggregated at the occupational level and summarised as totals or shares, e.g. number of full-time equivalents and persons, shares by age, qualification or gender. The data is aggregated at the level of occupational groups and the requirement level according to the Classification of Occupations 2010 (KldB2010, 3-digit plus 5th digit). For data protection reasons, the dataset only contains information on occupational group-requirement level combinations with more than 100 persons in 2012 (411 of these occupational aggregates in 2012). The data has also been merged with occupational information from previous IAB projects, such as the substitutability potential (Grienberger/Matthes/Paulus 2024), the Digital Tools Index (Genz/Janser/Lehmer 2019) and the Greenness of Jobs Index (Janser 2019/2024). We also provide the occupational panel separately for women and men, as well as aggregations at sectoral and federal state level (also separately for women and men).
Documentation
Grienberger, Katharina; Janser, Markus; Lehmer, Florian (2022). The Occupational Panel for Germany. Journal of Economics and Statistics. Online First. DOI: https://doi.org/10.1515/jbnst-2022-0053 .
Information on the terms of use of this publication can be found on the website of de Gruyter publishing group .
Contact