
The IAB LinkedIn industry switch radar maps current and future sideways movements of employees in the labour market. The radar is calculated by taking the average of two components:
- Current switches: the current ratio of people changing to a new job in a different industry
- Future switches: the current ratio of applications for jobs in a different industry relative to total applications
The IAB LinkedIn industry switch radar tracks switching behaviour almost in real time. In addition, the analysis of job applications provides a strong prognostic indicator of future switching behaviour. The radar is published every six months.
Job switches are recorded when a LinkedIn user updates their profile and assigns their new job to one of the 20 standard industries defined by the platform that differs from the industry they had selected for their previous role. Applications are measured using the online application form provided by LinkedIn. All data is aggregated and anonymised. Monthly time series are adjusted for seasonal effects.
One indicator of this is the IAB-LinkedIn sector change radar. It can be used to track movements on the labour market practically in real time. This is because a change is usually preceded by an application - and it is precisely this data that is available in LinkedIn. We use this data to create a leading indicator for the industry changes expected in the near future.
Job changes are measured when LinkedIn members update their profile and specify a job in another of the 20 industries standardised in LinkedIn. Applications are recorded via the online application form in LinkedIn. All data is aggregated and anonymised. The monthly time series are seasonally adjusted.
The result: after the coronavirus pandemic, the momentum of change has slowed once again with the energy crisis. Employees are currently switching comparatively little between sectors. This may be due to the fact that companies are increasingly holding on to their scarce labour force. However, there are signs of a trend reversal in 2024: Sector changes are stabilising and applications from other sectors are cautiously increasing.
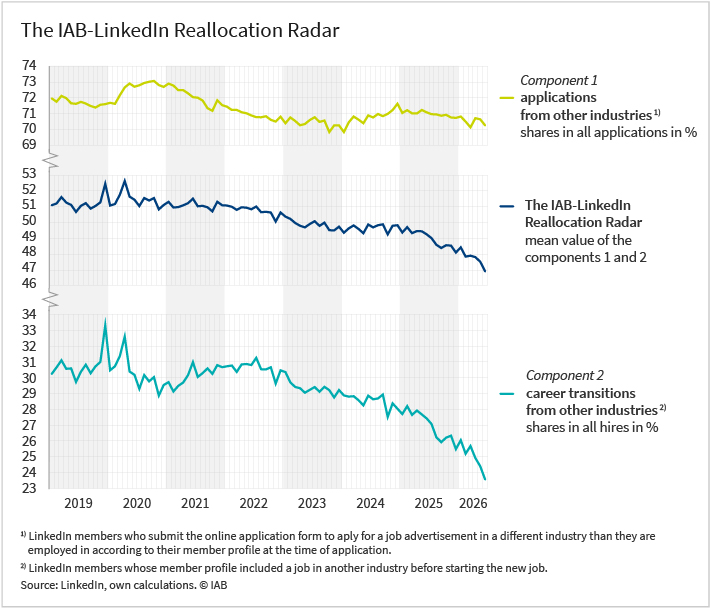
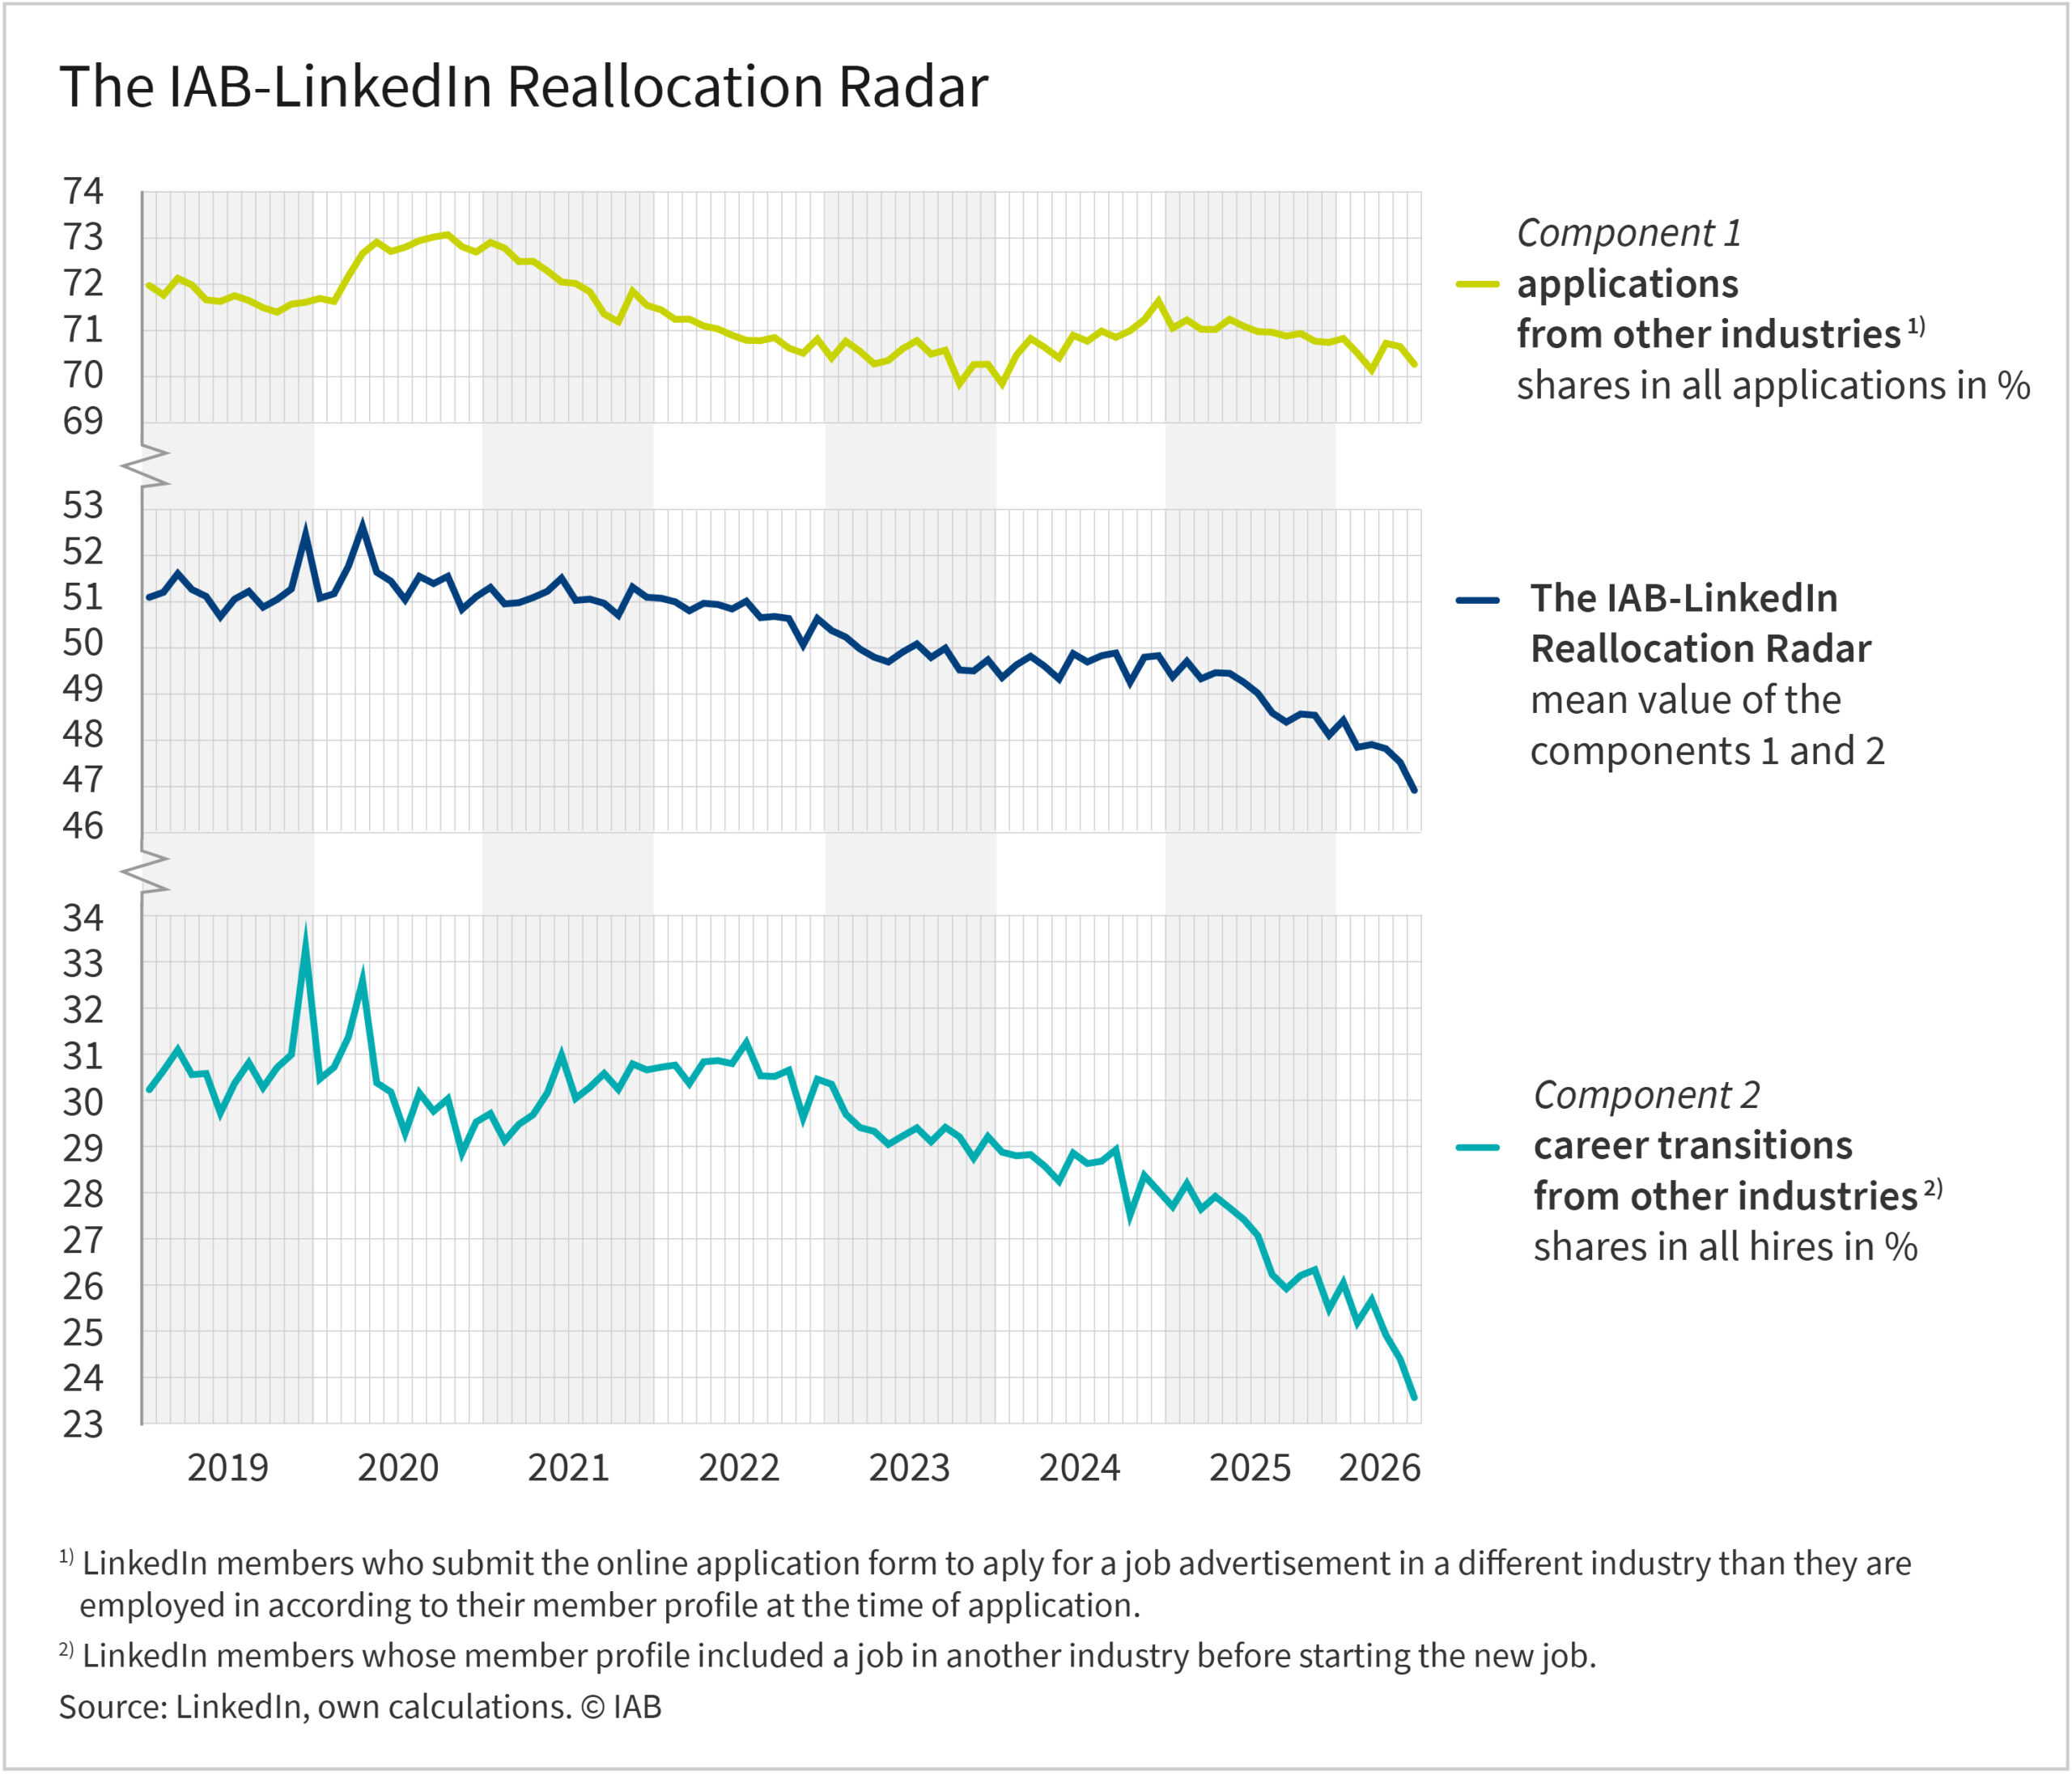
Table: The IAB LinkedIn Reallocation Radar
| Month/Year | IAB LinkedIn Reallocation Radar, mean value of the components 1 and 2 | Component 1: applications from other industries, shares in applications in % | Component 2: career transitions from other industries, shares in all hires in % |
|---|---|---|---|
| 2019 January | 51.10 | 71.97 | 30.23 |
| 2019 February | 51.21 | 71.76 | 30.65 |
| 2019 March | 51.61 | 72.13 | 31.09 |
| 2019 April | 51.27 | 71.99 | 30.55 |
| 2019 May | 51.12 | 71.66 | 30.58 |
| 2019 June | 50.68 | 71.63 | 29.72 |
| 2019 July | 51.06 | 71.76 | 30.37 |
| 2019 August | 51.23 | 71.65 | 30.81 |
| 2019 September | 50.88 | 71.49 | 30.28 |
| 2019 October | 51.05 | 71.39 | 30.71 |
| 2019 November | 51.28 | 71.57 | 30.99 |
| 2019 December | 52.46 | 71.61 | 33.30 |
| 2020 January | 51.08 | 71.69 | 30.46 |
| 2020 February | 51.17 | 71.63 | 30.71 |
| 2020 March | 51.77 | 72.17 | 31.36 |
| 2020 April | 52.63 | 72.67 | 32.59 |
| 2020 May | 51.65 | 72.91 | 30.38 |
| 2020 June | 51.45 | 72.71 | 30.18 |
| 2020 July | 51.05 | 72.81 | 29.29 |
| 2020 August | 51.55 | 72.95 | 30.16 |
| 2020 September | 51.39 | 73.03 | 29.76 |
| 2020 October | 51.55 | 73.08 | 30.03 |
| 2020 November | 50.84 | 72.81 | 28.86 |
| 2020 December | 51.11 | 72.70 | 29.53 |
| 2021 January | 51.31 | 72.91 | 29.71 |
| 2021 February | 50.95 | 72.78 | 29.12 |
| 2021 March | 50.98 | 72.49 | 29.48 |
| 2021 April | 51.09 | 72.50 | 29.69 |
| 2021 May | 51.23 | 72.29 | 30.16 |
| 2021 June | 51.51 | 72.05 | 30.98 |
| 2021 July | 51.03 | 72.02 | 30.04 |
| 2021 August | 51.06 | 71.84 | 30.28 |
| 2021 September | 50.97 | 71.36 | 30.58 |
| 2021 October | 50.71 | 71.19 | 30.24 |
| 2021 November | 51.32 | 71.85 | 30.79 |
| 2021 December | 51.10 | 71.54 | 30.66 |
| 2022 January | 51.08 | 71.45 | 30.72 |
| 2022 February | 51.00 | 71.24 | 30.76 |
| 2022 March | 50.80 | 71.25 | 30.36 |
| 2022 April | 50.97 | 71.10 | 30.83 |
| 2022 May | 50.95 | 71.03 | 30.86 |
| 2022 June | 50.85 | 70.90 | 30.80 |
| 2022 July | 51.02 | 70.79 | 31.25 |
| 2022 August | 50.66 | 70.78 | 30.53 |
| 2022 September | 50.68 | 70.85 | 30.52 |
| 2022 October | 50.64 | 70.62 | 30.65 |
| 2022 November | 50.07 | 70.51 | 29.62 |
| 2022 December | 50.64 | 70.82 | 30.46 |
| 2023 January | 50.38 | 70.41 | 30.35 |
| 2023 February | 50.23 | 70.77 | 29.70 |
| 2023 March | 49.98 | 70.55 | 29.40 |
| 2023 April | 49.80 | 70.28 | 29.33 |
| 2023 May | 49.70 | 70.35 | 29.04 |
| 2023 June | 49.91 | 70.61 | 29.22 |
| 2023 July | 50.09 | 70.78 | 29.40 |
| 2023 August | 49.79 | 70.49 | 29.10 |
| 2023 September | 49.99 | 70.58 | 29.41 |
| 2023 October | 49.53 | 69.85 | 29.20 |
| 2023 November | 49.50 | 70.26 | 28.74 |
| 2023 December | 49.74 | 70.27 | 29.21 |
| 2024 January | 49.36 | 69.85 | 28.88 |
| 2024 February | 49.63 | 70.46 | 28.80 |
| 2024 March | 49.82 | 70.83 | 28.82 |
| 2024 April | 49.60 | 70.63 | 28.57 |
| 2024 May | 49.33 | 70.41 | 28.25 |
| 2024 June | 49.88 | 70.90 | 28.86 |
| 2024 July | 49.70 | 70.76 | 28.63 |
| 2024 August | 49.83 | 70.99 | 28.68 |
| 2024 September | 49.89 | 70.85 | 28.93 |
| 2024 October | 49.26 | 71.00 | 27.52 |
| 2024 November | 49.80 | 71.24 | 28.37 |
| 2024 December | 49.83 | 71.63 | 28.03 |
| 2025 January | 49.38 | 71.06 | 27.70 |
| 2025 February | 49.71 | 71.23 | 28.19 |
| 2025 March | 49.34 | 71.03 | 27.64 |
| 2025 April | 49.47 | 71.02 | 27.92 |
| 2025 Mai | 49.45 | 71.24 | 27.67 |
| 2025 Juni | 49.26 | 71.09 | 27.42 |
| 2025 Juli | 49.02 | 70.97 | 27.06 |
| 2025 August | 48.59 | 70.96 | 26.22 |
| 2025 September | 48.40 | 70.88 | 25.92 |
| 2025 October | 48.57 | 70.93 | 26.20 |
| 2025 November | 48.55 | 70.77 | 26.33 |
| 2025 December | 48.11 | 70.74 | 25.48 |
| 2026 January | 48.43 | 70.82 | 26.04 |
| 2026 February | 47.85 | 70.51 | 25.19 |
| 2026 March | 47.91 | 70.15 | 25.67 |
| 2026 April | 47.82 | 70.73 | 24.91 |
| 2026 Mai | 47.52 | 70.65 | 24.40 |
| 2026 Juni | 46.91 | 70.27 | 23.56 |
Source: LinkedIN, own calculations.
Authors

Date of publication
2026/8/20
Downloads
Rights of use
The IAB LinkedIn Reallocation Radar is published under the following Creative Commons license: Attribution-ShareAlike 4.0 International (CC BY-SA 4.0)
Publication medium
The IAB-LinkedIn Reallocation Radar: “Great Resignation” is not a trend
Weber, Enzo; Erer, Murat (2023): The IAB-LinkedIn Reallocation Radar: “Great Resignation” is not a trend, In: IAB-Forum 14th of August 2023, https://www.iab-forum.de/en/the-iab-linkedin-reallocation-radar-great-resignation-is-not-a-trend/, Retrieved: 14th of August 2023
Period analysed
January 2019 until June 2026